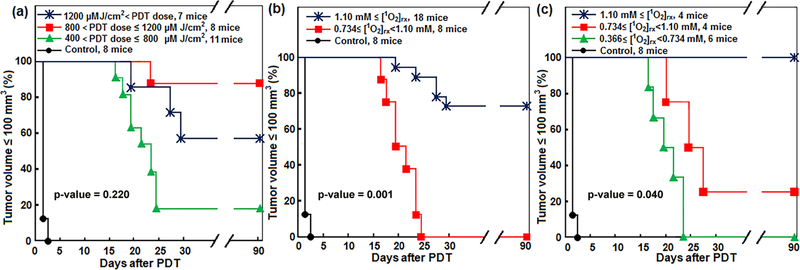
Figure 2.
Survival curves for Photofrin-mediated PDT. The impact of (a) calculated PDT dose and (b) singlet oxygen concentration ([1O2]rx) obtained using initial tissue oxygenation ([3O2]0) immediately before PDT (SOED1) and (c) [1O2]rx obtained using the whole tissue oxygenation ([3O2]) spectra during PDT (SOED2) on the local control rate of RIF tumors within 90 d follow-up. The maximum p values are calculated using the Log-rank test to show statistical difference among different independent treated groups.

