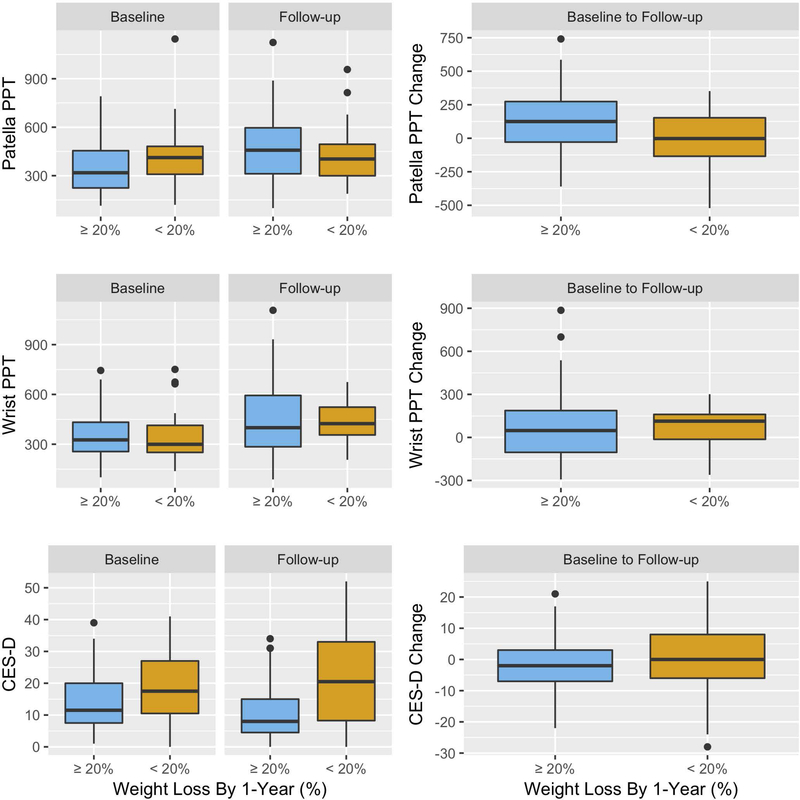
Figure 3.
Boxplots of baseline and follow-up measures of the pressure pain threshold (PPT) for index patella and right wrist, and Center for Epidemiologic Studies Depression (CES-D) scale stratified by weight loss at 1-year.
The middle bold horizontal lines are the median (i.e. 50th percentile). The lower and upper hinges are the first (i.e. 25th percentile) and third (i.e. 75th percentile) quartiles. Dots along the whiskers are beyond the 1.5 times of the interquartile range.

