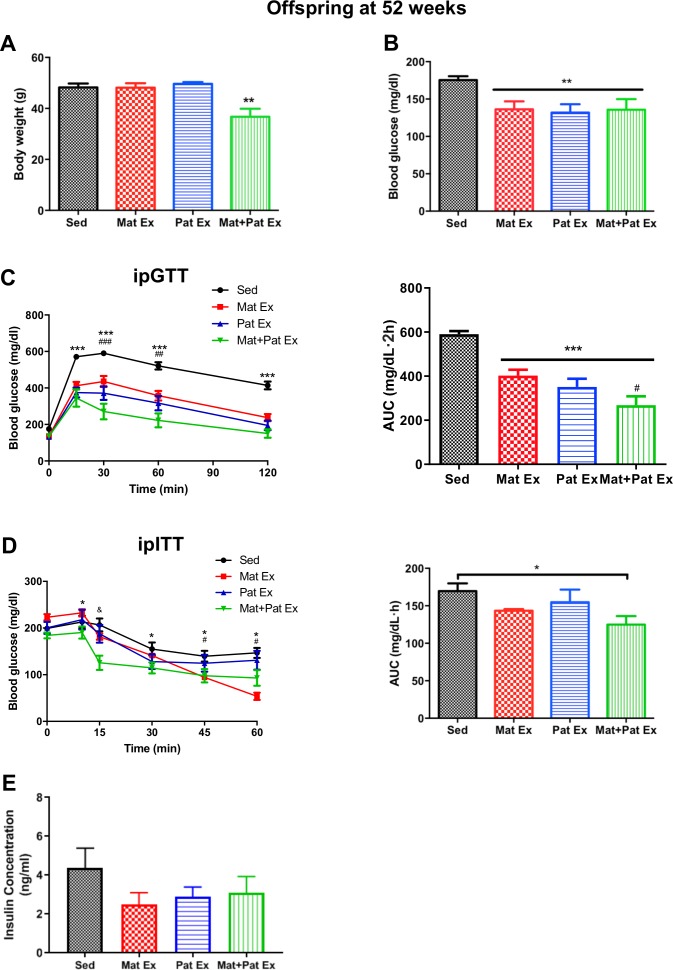
Figure 2.
Improved glucose metabolism in male offspring from high-fat fed, exercised parents at 52 weeks of age. (A) Body weight of male offspring at 52 weeks of age. **P<0.01 versus all groups. (B) Blood glucose of male offspring at 52 weeks of age, 6 hours fasted. **P<0.01 versus Sed. (C) Intraperitoneal glucose tolerance test (ipGTT) (left) and AUC (right) of male offspring at 52 weeks of age. ***P<0.001 Sed versus all groups at 10, 30, 60 and 120 min; ##p<0.01; ###p<0.001. Mat+Pat Ex versus Mat Ex at 30 and 60 min. ***P<0.001 versus Sed; #p<0.05 versus Mat Ex. (D) Intraperitoneal insulin tolerance test (ipITT) (left) and AUC (right) of male offspring at 52 weeks of age. *P<0.05 Mat+Pat Ex versus Sed at 10, 30, 45 and 60 min; #p<0.05 Mat Ex versus Sed at 45 and 60 min; &p<0.001 Mat+Pat Ex versus all groups at 15 min. *P<0.05 versus Sed. (E) Fasted insulin concentrations of male offspring at 52 weeks of age, 12 hours fasted. Data represent mean±SEM. n=6 litters in each group. AUC, area under the curve; Mat Ex, maternal exercise; Mat+Pat Ex, both maternal and paternal exercise; Pat Ex, paternal exercise; Sed, sedentary.

