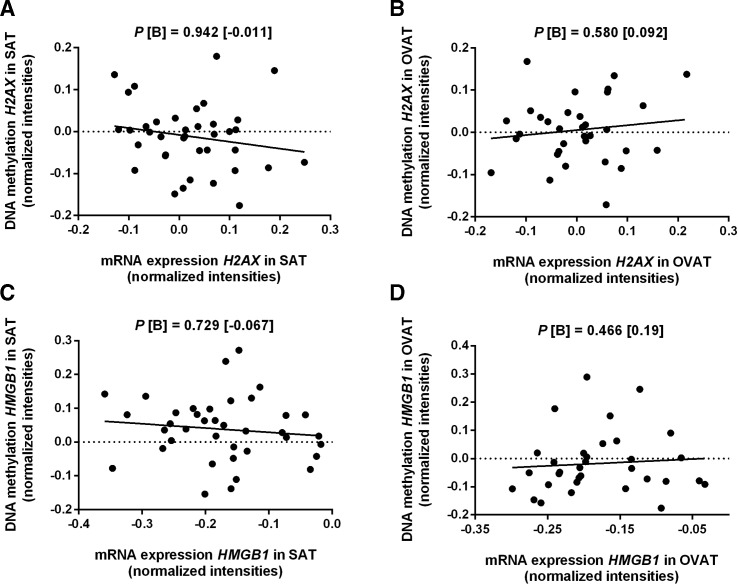
Figure 3.
Adipose tissue depot-specific correlations of H2AX and HMGB1 gene expression and DNA promoter methylation. (A–D) Data were calculated using linear regression analyses adjusted for age, sex, BMI in (A, C) n=38 and in (B, D) n=33. B, regression coefficient; BMI, body mass index; OVAT, omental visceral adipose tissue; P, P-value; SAT, subcutaneous adipose tissue.

