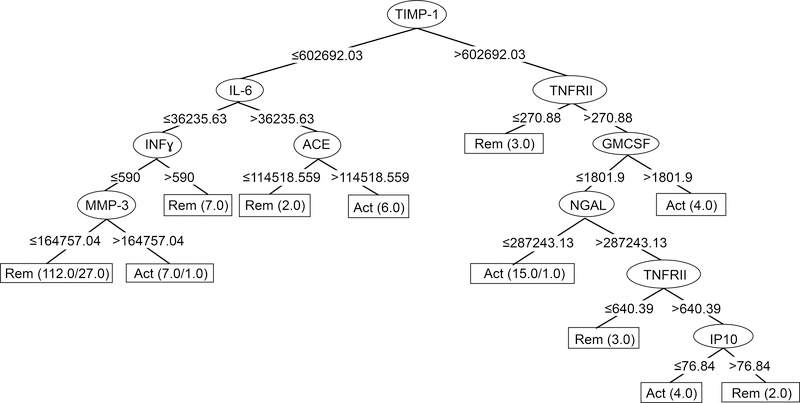
Figure 2.
J48 Classification Tree for GCA biomarkers. Starting at the top, each decision node (oval) shows the marker to be used in a classification step. The marker level cut-point (in mm/hr for ESR, pg/ml for the others) is shown at each branch point, with values less than the cut-point moving a sample to the left and values greater than the cut-point going to the right. Classification of the sample by the algorithm as active disease (Act) or remission (Rem) is complete when it reaches one of the terminal nodes, shown as rectangles. Numbers in the terminal nodes show the total number of samples classified into the node followed by the number incorrectly classified, if any. For example, in the left-most terminal node, the tree has classified 112 samples sharing the properties of low TIMP-1, low IL-6, low IFNγ, and low MMP-3 as remission: 85 remission samples classified correctly, and 27 active samples classified incorrectly. Evaluation of the overall tree in classifying remission is determined by adding the numbers of samples correctly classified in Rem terminal nodes (102) and comparing to the number incorrectly classified in Act terminal nodes (2). Conversely, performance in classifying active disease involves comparing the numbers correctly classified in Act terminal nodes (34) to the numbers incorrectly classified in Rem terminal nodes (27).

