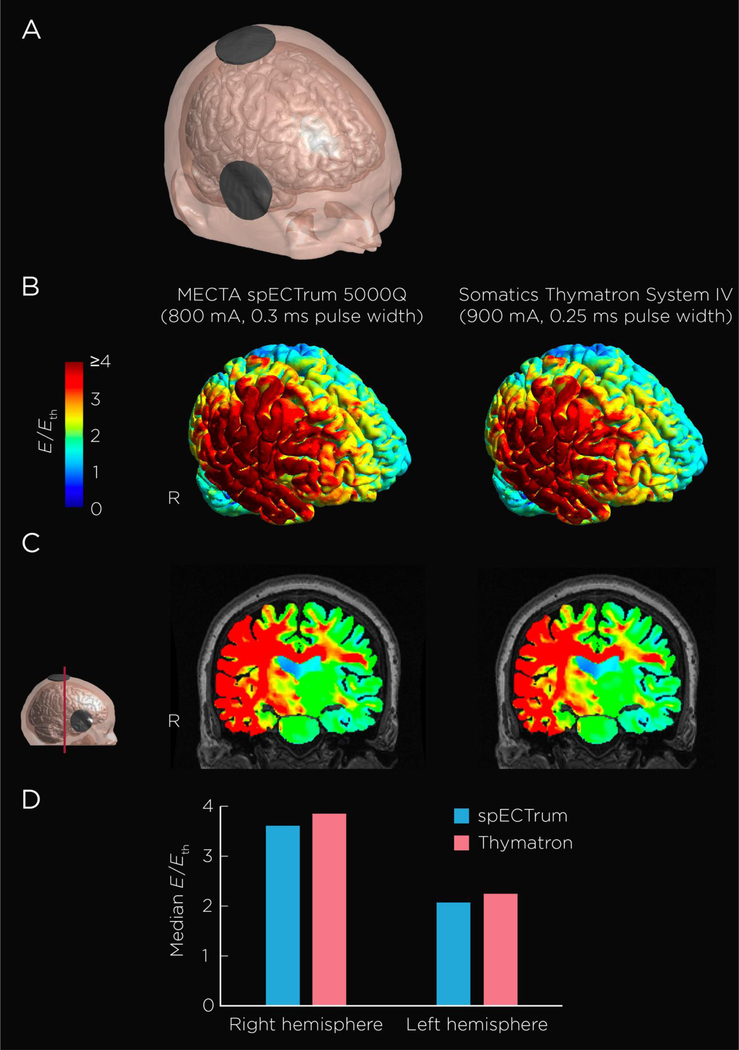
Figure 1. Electroconvulsive Therapy Electric Field Model.
Figure 1 shows an anatomically realistic head model constructed from magnetic resonance imaging (MRI) and diffusion tensor imaging (DTI) data of one healthy, 62-year-old, male subject. (A) Head model showing the right unilateral ECT electrode placement. (B) Stimulation strength (electric field magnitude relative to neural activation threshold, E/Eth) on the cortical surface induced the MECTA spECTrum 5000Q and Somatics Thymatron System IV devices. (C) Coronal view of the field distribution. (D) Median E/Eth in the right and left hemispheres.

