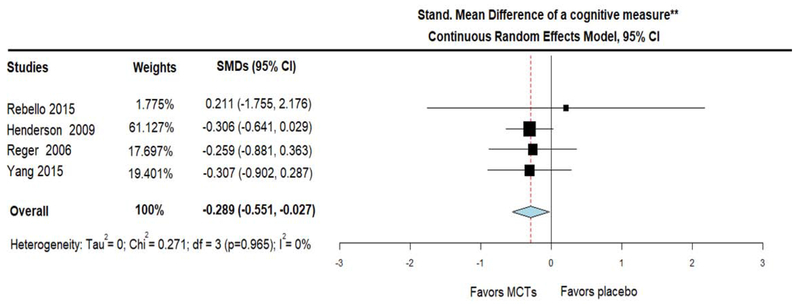
Figure 5B.
Forest plot showing cognitive performance (measured with Standardized Mean Difference derived from changes on (i) the Spanish version of MMSE in Yang et al study and (ii) ADAS-Cog for the rest studies). Results from meta-analysis of 4 Randomized Controlled Trials, using Continuous Random-Effects Model. Note that as with ADAS-Cog scale, negative changes here also indicate cognitive improvement

