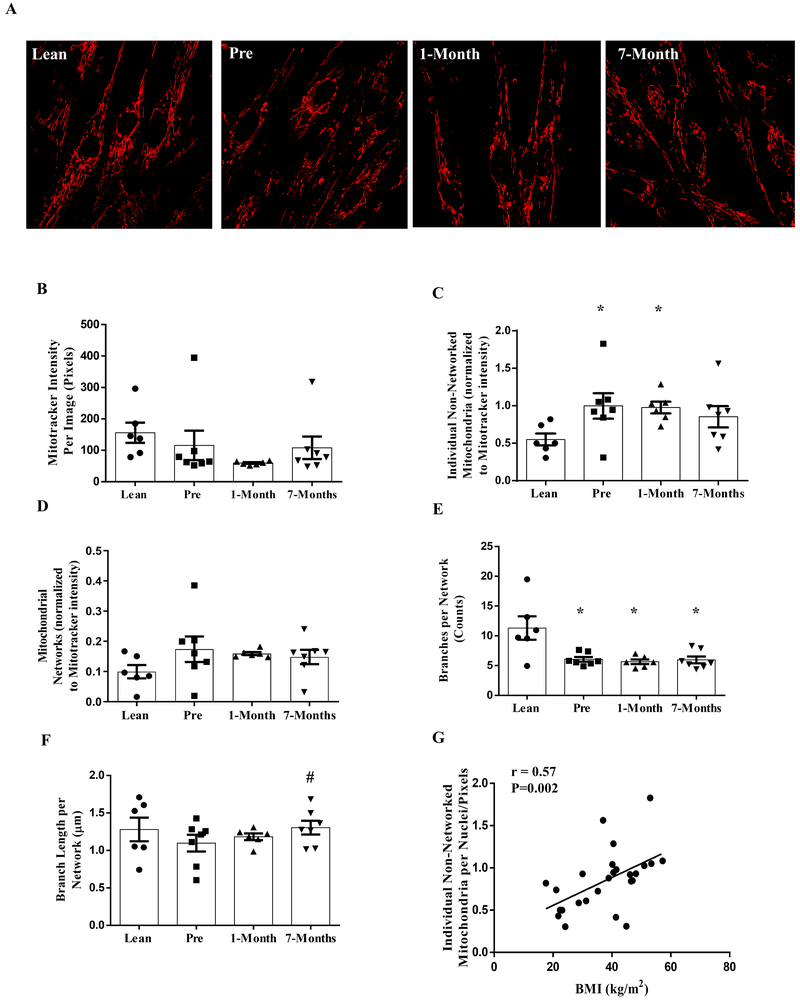
Figure 3:
Mitochondrial morphology in primary human myotubes derived from lean and severely obese humans before (Pre), 1-month, and 7-months after RYGB surgery. (A) Representative images of myotubes stained with MitoTracker™ RedFM. (B) Mitotracker intensity. (C) Number of individual non-networked mitochondria (D) Number of mitochondrial networks. (E) Number of branches per network (network size). (F) Average branch length per network (network size). (G) Correlation between body mass index (BMI) and the number of individual non-networked mitochondria. Data are presented as mean ± SEM. n = 6, Lean and 1-month post-RYGB; n = 7, Pre and 7-months post-RYGB. * P < 0.05 vs. Lean; # P < 0.05 vs. Pre.

