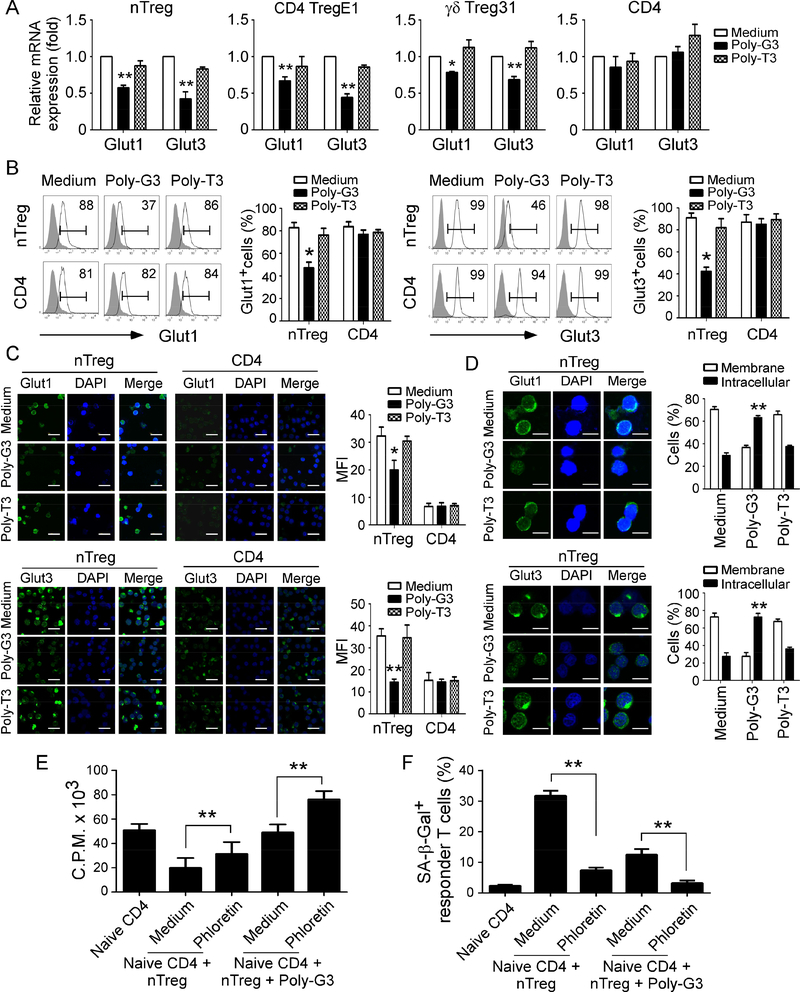
Figure 4. TLR8 signaling down-regulates the expression levels and membrane translocation of glucose transporters Glut1 and Glut3 in Treg cells.
(A) and (B) Poly-G3 treatment down-regulated gene (in A) and protein (in B) expressions of Glut1 and Glut3 in human Treg cells. Treg and control CD4+CD25− effector cells were treated with Poly-G3 (3 μg/ml) for 48 hours. Total RNA was isolated from the T cells and analyzed by real-time PCR. The expression levels of each gene were normalized to β-actin expression levels and adjusted to the levels in untreated T cells (in A). Treated nTreg cells were also determined for Glut1 and Glut3 protein expression using the flow cytometry analysis (in B). Data shown in histograms are representative of average of three independent experiments ± SD. *p<0.05 and **p<0.01, compared with the medium only group. (C) Decreased Glut1 and Glut3 protein expression was induced by Poly-G3 treatment in nTreg cells but not in control CD4+ T cells after 3-day culture. Glut1 and Glut3 (green) expression was determined by an indirect immunofluorescence assay with a confocal microscopy. Scale bar, 50 μm. Results shown in the right histograms are mean ± SD of fluorescence intensity (MFI) quantifications of glucose transporters from three independent experiments. *p<0.05 and **p<0.01, compared with the medium only group. (D) Poly-G3 treatment down-regulated Glut1 and Glut3 membrane expression and promoted its intracellular translocation in nTreg cells. Cell treatment and procedure were identical to (C). Percentages of glucose transporter expression in cell membrane or intracellular were counted and shown in the right histograms. Scale bar, 25 μm. Results are mean ± SD of positive cells from three independent experiments. **p<0.01, compared with the medium only group. (E) and (F) Inhibition of glucose transport significantly promoted the Poly-G3-mediated reversal of Treg suppression on responder T cell proliferation (in E) and induction of cell senescence (in F). nTreg cells were pretreated with or without glucose transporter inhibitor phloretin (2 μM) for 2 days, and then co-cultured with naive CD4+ T cells in the presence or absence of Poly-G3 (3 μg/ml) for 3 days. Proliferation of co-cultured naïve T cells stimulated with anti-CD3 antibody was determined by [3H]-thymidine incorporation assays (in E), and SA-β-Gal expression in treated T cells was determined (in F). Data shown are mean ± SD from three independent experiments with similar results. **p<0.01 between the comparison groups.

