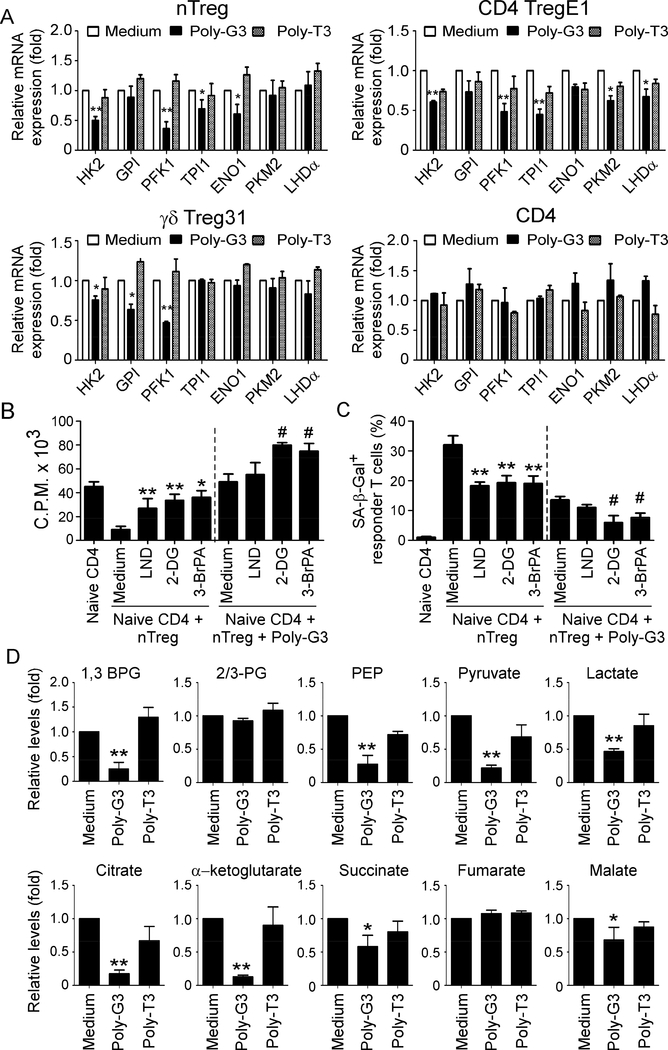
Figure 5. TLR8 signaling inhibits molecular processes of glycolysis in Treg cells.
(A) Poly-G3 treatment significantly down-regulated gene expression levels of key glycolytic enzymes in both nTreg and tumor-derived Treg cells. Different types of human Treg cells and control effector CD4+ T cells were treated with or without Poly-G3 or Poly-T3 for 48 hours. Total RNA was isolated from the T cells and analyzed by real-time PCR. The expression levels of each gene were normalized to β-actin expression levels and adjusted to the levels in untreated T cells (medium). Data shown in nTreg and control CD4+ T cells are mean ± SD from four independent donors. Data for CD4 TregE1 and γδ Treg31 are averages of three independent experiments. *p<0.05 and **p<0.01, compared with the medium only group. (B) and (C) Blockage of glycolysis in nTreg cells using specific pharmacological inhibitors dramatically enhanced the effects of Poly-G3-mediated reversal of Treg suppression on responder T cell proliferation (in B) and induction of cell senescence (in C). nTreg cells were pretreated with glycolysis inhibitors, including 2-DG (1 mM), LND (125 μM), and 3-BrPA (30 μM), respectively for 48 hours. Naïve CD4+ T cells were then co-cultured with inhibitor-pretreated or untreated Treg cells for 3 days in the presence or absence of Poly-G3. Proliferation of co-cultured naïve T cells stimulated with anti-CD3 antibody was determined by [3H]-thymidine incorporation assays (in B), and SA-β-Gal expression in treated T cells was determined (in C). Data shown are mean ± SD from representative of three independent experiments with similar results. **p<0.01 and #p<0.01, compared with the respective medium only group. (D) TLR8 signaling activation decreased the key metabolites involved in glycolysis and TCA in nTreg cells. nTreg cells were cultured in T cell medium in the presence of Poly-G3 or Poly-T3 for 72 hours. Glucose metabolites from the nTreg cell lysates were analyzed using a LC-triple quadruple mass spectrometry, and metabolite levels are normalized to medium group. Relative levels of intermediate metabolites in the glycolysis and TCA-cycle pathways are shown. Data shown are mean ± SD from representative of three independent nTreg cells with similar results. *p<0.05 and **p<0.01, compared with the medium only group.

