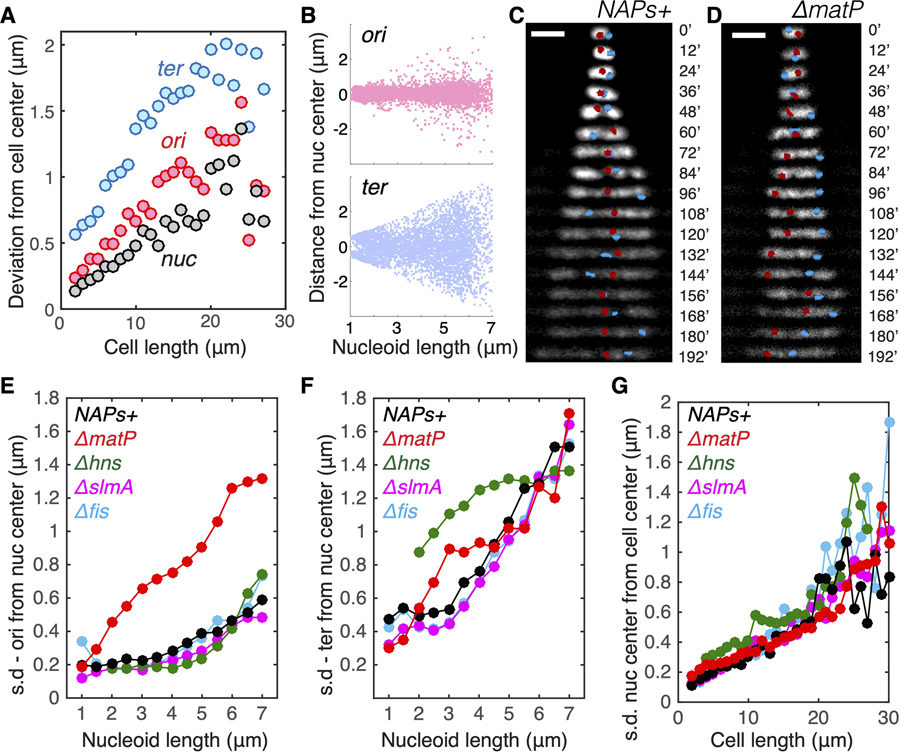
Figure 5. Persistent Positioning of Single Chromosome Independent of NAP-Modulated Sub-structuring.
(A) Deviation (mean square root distance) of the nucleoid center, Ori locus, and Ter locus from the cell center in cells of different lengths.
(B) Distances of Ori and Ter loci from the center of nucleoids in relation to nucleoid length.
(C) Time-lapse images showing the positioning of Ori locus (red) and Ter locus (blue) in single nucleoids over time. Scale bars, 2 μm.
(D) Time-lapse images showing the positioning of Ori locus and Ter locus in single nucleoids over time for the DmatP strain.
(E) Deviation (mean square root distance) of the Ori foci from the nucleoid center in different mutants in different cell lengths. NAPs+ denote the control strain with all NAPs present.
(F) Deviation (mean square root distance) of the Ter foci from the nucleoid center in different mutants in different cell lengths.
(G) Deviation (mean square root distance) of the nucleoid center of mass from the cell center in different mutants in different cell lengths.
See also Figure S5.

