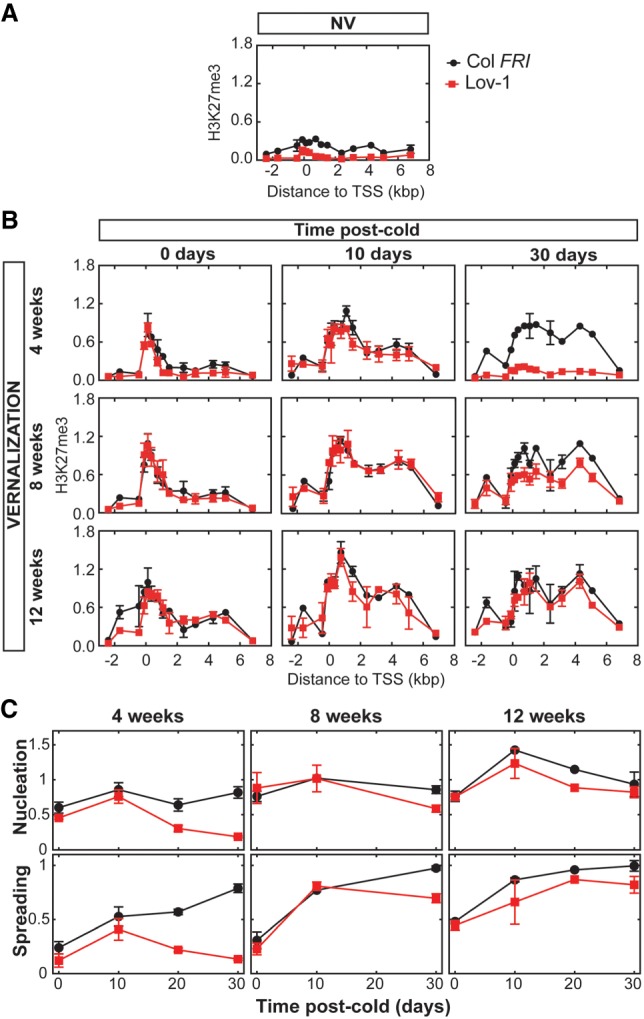
Figure 2.

Cell population level H3K27me3 initially accumulates at Lov-1 FLC, but can subsequently be lost. (A) Comparison of Col FRI and Lov-1 H3K27me3 levels along the FLC locus using ChIP qPCR with primers in the locations indicated after 10 d of growth at 22°C. (B) As for A, showing samples following the indicated vernalization and postcold treatment. (C) The data of B (with additional time points 20 d warm after 4 and 12 wk of cold) shown as the average value of all primers in the nucleation region (fifth through eighth primers of Supplemental Table S1) and body region (denoted as “spreading”) (12th–13th primers of Supplemental Table S1). (A,B) Values are means ± SEM of two to four biological replicates. (C) Error bars indicate SEM.
