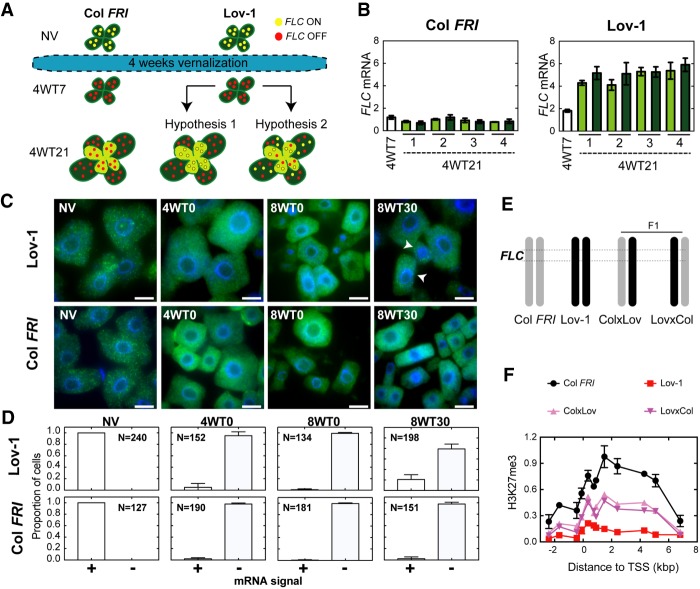
Figure 3.
Stochastic and cell autonomous reactivation of Lov-1 FLC. (A) Schematic depicting the experimental design. Col FRI and Lov-1 plants were pregrown for 7 d (NV) and then vernalized for 4 wk. Cells with active (on) or inactive (off) FLC expression are represented with yellow and red circles, respectively. After vernalization, plants were moved to warm conditions. At 7 d after cold, vernalized plants were divided into two groups: (1) Leaf samples were collected (4WT7) for RNA extraction, and (2) all leaves were marked with a pen and the plants were allowed to grow for two additional weeks. At the end of this period (4WT21), leaves that were present at 4WT7 (old leaves, dark green) and leaves that arose after 4WT7 (new leaves, pale green) were sampled separately. xWTy refers to y days of warm following x weeks of cold treatment. (B) Expression of FLC mRNA in Col FRI and Lov-1 plants at 7 d (4WT7) and 21 d (4WT21) after cold. White bars represent 4WT7 data. Dark-green and pale-green bars represent FLC levels in old and new leaves at 4WT21 (dashed line), respectively. Numbers on X-axes (1–4) depict the four individual plants tested at 4WT21. One-tailed, paired Student's t-test results: P-value = 0.9578 testing whether new leaves have higher FLC than old leaves at 4WT21 in Lov-1; P-value = 0.4939 for the same in Col FRI. One-tailed, two-sample t-test results: P-value =3.572 × 10⁻⁶ testing whether pooled 4WT21 leaves have higher FLC than 4WT7 in Lov-1; P-value = 0.9916 for the same in Col FRI. (C) smRNA FISH showing FLC mRNA in isolated root meristematic cells from Lov-1 and Col FRI plants, either nonvernalized (NV) or treated with 4 (4WT0) and 8 (8WT0) wk of cold, and then 30 d (8WT30) in postcold warm. Cells showing stochastic reactivation (arrowheads). Scale bars, 10 μm. (D) Quantification of the number of cells with (+) and without (−) FLC mRNA signal at the time points depicted in C. N = number of cells analyzed. (E) Schematic structure of chromosome 5 of Col FRI (gray), Lov-1 (black) and F1 plants generated from reciprocal crosses between Col FRI and Lov-1. Dashed lines depict the FLC region. (F) ChIP-qPCR profiles of H3K27me3 at 30 d following a 4-wk vernalization treatment (4WT30) in Col FRI, Lov-1, and crosses. Lov-1 and Col FRI data are means ± SEM of two biological replicates. Data for one biological replicate is shown for each type of F1. Leaves of 24 individual plants were sampled for each biological replicate.

