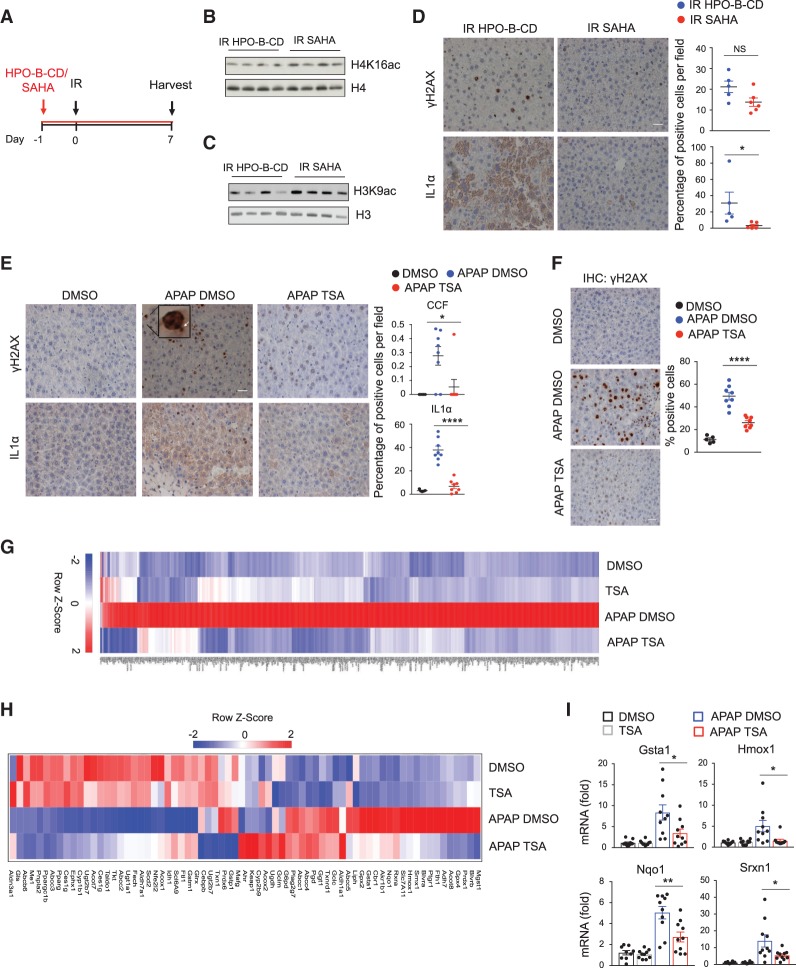
Figure 7.
HDAC inhibitors suppress inflammation in vivo. (A) Scheme of experimental design in B–D. C57BL/6 mice were pretreated with vehicle (HPO-β-CD) or SAHA (0.1 g/L) in drinking water, subjected to irradiation (IR, 4Gy), and administrated vehicle (HPO-β-CD) or SAHA in drinking water for seven more days. Seven days after IR, livers were harvested. (B,C) Livers were lysed and analyzed for H4K16ac, H4, H3K9ac, and H3 by immunoblotting. (D) Livers were stained for γH2AX and IL1α and quantified. Representative immunohistochemistry images are shown. N = 5 mice. Data are the mean ± SEM. Statistical significance was calculated using unpaired two-tailed Student's t-test. (*) P < 0.05; (NS) not significant. Scale bar, 20 μm. (E) Livers from mice treated as indicated were harvested 48 h after APAP administration, stained for γH2AX and IL1α. CCFs are indicated by arrows. The percentage of cells positive for CCFs and IL1α is shown. Representative immunohistochemistry images are shown. N = 5 mice for DMSO; n = 8 for APAP DMSO and APAP TSA. Scale bar, 20 μm. Data represent the mean ± SEM. Statistical analysis was performed with unpaired two-tailed Student's t-test. (****) P < 0.0001; (*) P < 0.05. (F) Livers from mice treated as indicated were harvested 48 h after APAP administration and stained for γH2AX and quantified. Representative immunohistochemistry images are shown. N = 5 mice for DMSO; n = 8 for APAP DMSO and APAP TSA. Scale bar, 20 μm. Data represent the mean ± SEM. Statistical analysis was performed with unpaired two-tailed Student's t-test. (****) P < 0.0001. (G,H) Livers were harvested 14 h after APAP injection, lysed, and subjected to RNA-seq analysis. (G) Heat map of RNA-seq analysis showing all genes that are significantly up-regulated in APAP DMSO versus untreated mice and significantly down-regulated in APAP TSA versus APAP DMSO. N = 4 mice per group. (H) Heat map of RNA-seq analysis of NRF2 target genes in mice treated as indicated, 14 h after APAP administration. N = 4 mice for cohort. Color intensities are Z-scores of the mean FPKM expression. (I) RT-qPCR analysis of NRF2 target genes in the liver of mice treated as indicated, 14 h after APAP administration. N = 10 mice for group. Data represent the mean ± SEM. Statistical analysis was performed with unpaired two-tailed Student's t-test. (**) P < 0.01; (*) P < 0.05.

