Figure 3.
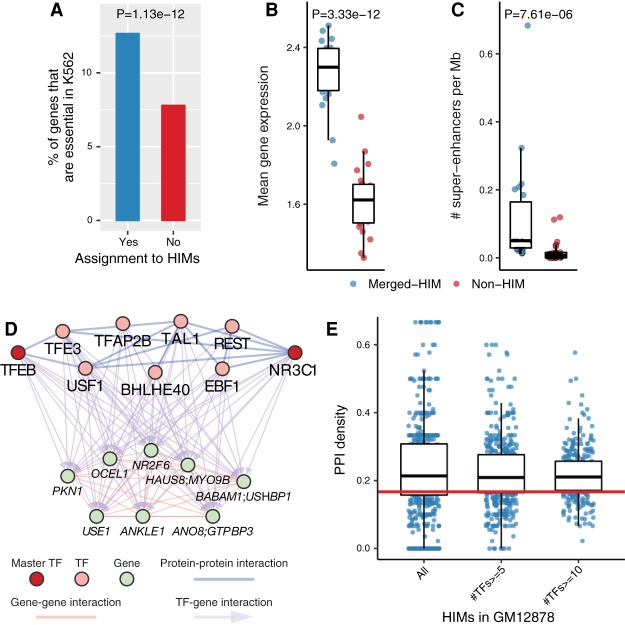
HIMs are enriched with essential genes, super-enhancers, and protein–protein interactions. (A) Barplots show the proportions of genes that are K562 essential genes among the genes assigned to HIMs and those not assigned to HIMs. (B,C) Functional properties of the genes in the identified HIMs in K562. To make a fair comparison, we group the genes assigned to HIMs by chromosome number and called the resulting clusters as merged-HIM clusters. Similarly, we derive non-HIM clusters from the genes in the heterogeneous networks but not assigned to HIMs. P-values are computed by the paired two-sample Wilcoxon rank-sum test. (B) Boxplot shows the average gene expression level of the genes in a cluster. (C) Boxplot shows the normalized number of super-enhancers related to a cluster. (D,E) TFs in HIMs are enriched with protein–protein interactions (PPIs) among themselves. (D) One example of HIM from GM12878 shows that nine TFs in the HIM are connected by 14 PPIs. The sub-PPI network has a density at 0.389. The TFs NR3C1 and TFEB are master TFs in GM12878. (E) Boxplots show the distribution of the sub-PPI network density of the HIMs and the subsets of HIMs with at least n TFs, n = 5, 10. The medians are significantly (P < 2.22 × 10⁻¹⁶) higher than the expected density (0.158; red line) of the sub-PPI networks induced by randomly sampled TFs.

