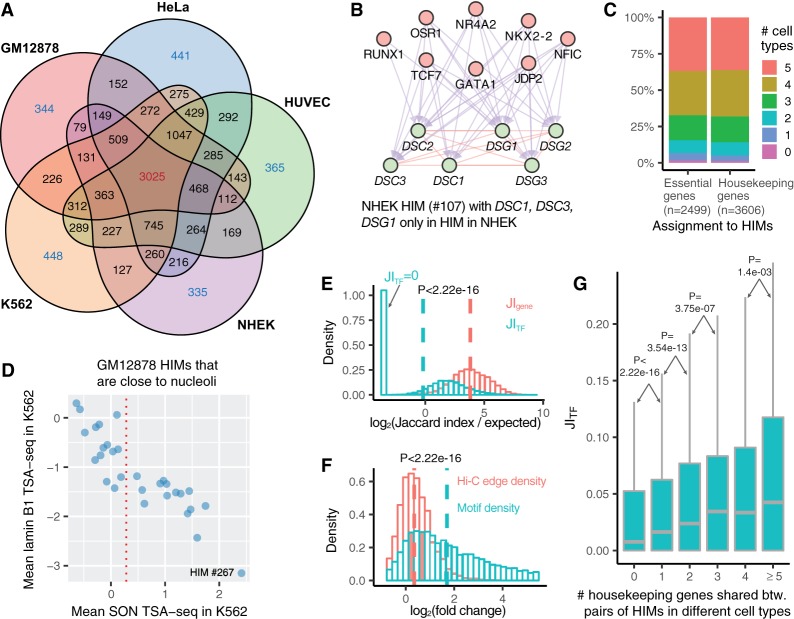
Figure 4.
HIM comparisons in terms of genes and TFs across the cell types. (A) Venn diagram shows the assignment of genes in HIMs across five cell types. Numbers in each facet represent the gene number in each possible intersection relationship across five cell types. (B) A NHEK HIM with three genes only assigned to HIMs in NHEK. All of its genes are involved in the keratinization pathway. Here the top and bottom nodes are the TFs and genes in the HIM, respectively. (C) Barplot shows the assignment of essential genes and housekeeping genes to HIMs across five cell types. (D) Scatter plot shows the mean SON TSA-seq and lamin B1 TSA-seq scores (in K562) (Chen et al. 2018) of the 30 GM12878 HIMs that are inferred as close to nucleoli in GM12878 (Quinodoz et al. 2018). The red vertical dotted line represents the mean SON TSA-seq score at 0.284. (E) The log-transformed ratio of the Jaccard index on the genes/TFs between paired HIMs from different cell types over the expected Jaccard index between random control sets. (F) Fold changes of motif M density and Hi-C edge density of each HIM between the cell type in which it is identified and another cell type. Here a vertical dash line represents the median of a variable. (G) Boxplots represent the distribution of the Jaccard index on the TFs of paired HIMs with different numbers of shared housekeeping genes.

