Figure 2.
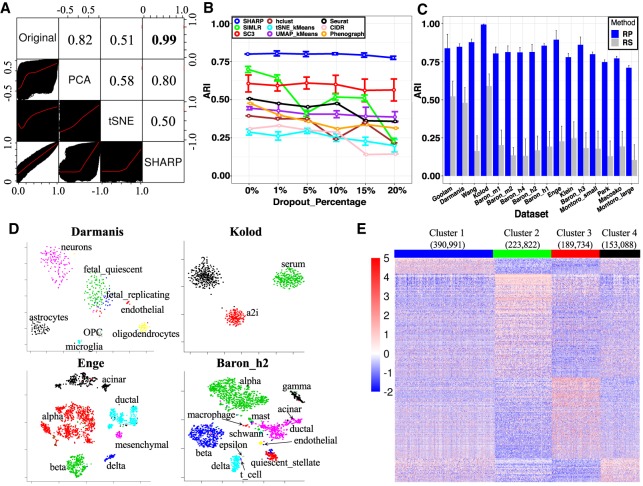
The properties of SHARP. (A) Cell-to-cell distance preservation in SHARP space compared with that in t-SNE and PCA for the Enge data set (Enge et al. 2017). The lower triangular part shows the scatter plots of the cell-to-cell distances, whereas the upper triangular part shows the Pearson's correlation coefficient (PCC) of the corresponding two spaces. (B) SHARP is robust to the additional dropout events on the Montoro_small (Montoro et al. 2018) data set. (C) Comparing RP (SHARP uses RP) with random gene selection (RS) in 16 single-cell RNA-seq data sets (Darmanis et al. 2015; Klein et al. 2015; Kolodziejczyk et al. 2015; Macosko et al. 2015; Baron et al. 2016; Goolam et al. 2016; Wang et al. 2016; Enge et al. 2017; Montoro et al. 2018; Park et al. 2018) with the number of single cells ranging from 124 to 66,265. (D) Visualization capabilities of SHARP in the Darmanis (Darmanis et al. 2015), Kolod (Kolodziejczyk et al. 2015), Enge (Enge et al. 2017), and Baron_h2 (Baron et al. 2016) data sets. (E) Cluster-specific marker gene expression of the top four major clusters for 1.3 million single cells (10x Genomics 2017) by SHARP. The total number of clusters predicted by SHARP is 244. The number in brackets represents the number of single cells in the corresponding cluster.

