Figure 4.
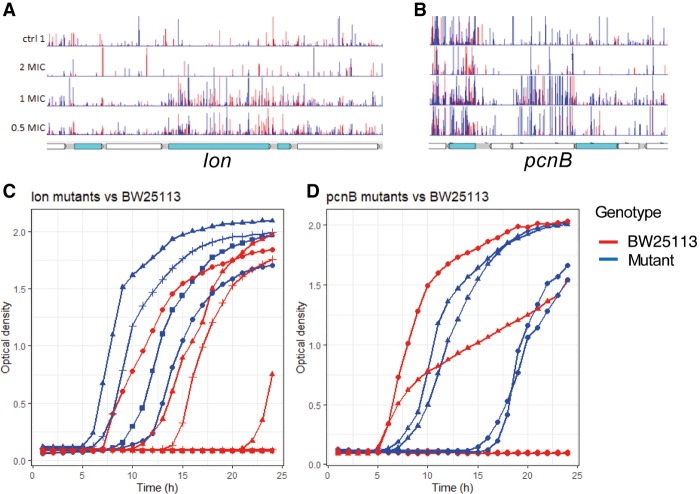
Impact of lon and pcnB on triclosan sensitivity. (A,B) Insert patterns indicating inactivation of lon and pcnB is beneficial for survival in the presence of triclosan. The format of these genetic maps is as described in Figure 1. (C,D) Growth curves for BW25113 and isogenic mutants grown in LB broth supplemented with 0.125 mg/L of triclosan. Mutants were replicated on multiple plates. Each line indicates the average from an individual plate; independent plates are represented by symbols (triangles, circles, or squares; allowing comparison between the mutant and parent from each individual plate). Red lines indicate BW25113; blue lines, mutants.

