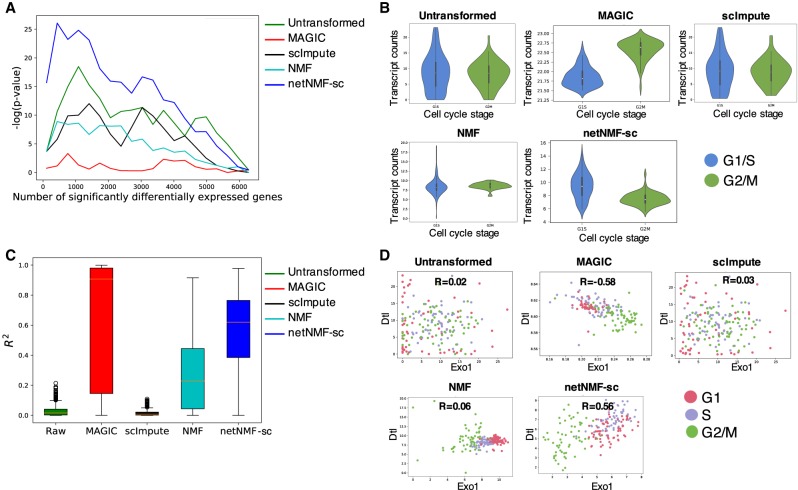
Figure 5.
Comparison of differential expression of marker genes and gene–gene correlations in untransformed data from Buettner et al. (2015) and data imputed using netNMF-sc, NMF, scImpute, and MAGIC. (A) Overlap between differentially expressed genes and periodic genes (log P-values from Fisher's exact test). (B) Expression of the G1/S phase marker gene Exo1 in cells labeled as G1/S (blue) and cells labeled as G2/M (green) in data imputed by each method. In netNMF-sc inputed data, Exo1 is overexpressed in G1/S cells compared to G2/M cells (P ≤ 6.7 × 10⁻¹²), as expected. In contrast, in data imputed by MAGIC, Exo1 is underexpressed in G1/S cells compared to G2/M cells (P ≤ 2.2 × 10⁻¹⁶). Exo1 shows no difference in expression in untransformed and scImpute data. (C) Distribution of R2 correlation coefficients between pairs of periodic genes in the cell cycle data. (D) Scatter plot of expression of two G1/S phase genes, Dtl and Exo1, across cells. These genes are positively correlated in data imputed by netNMF-sc (P ≤ 2.2 × 10⁻¹⁶), negatively correlated in data imputed by MAGIC (P ≤ 2.2 × 10⁻¹⁶), and uncorrelated in other methods.

