Figure 4.
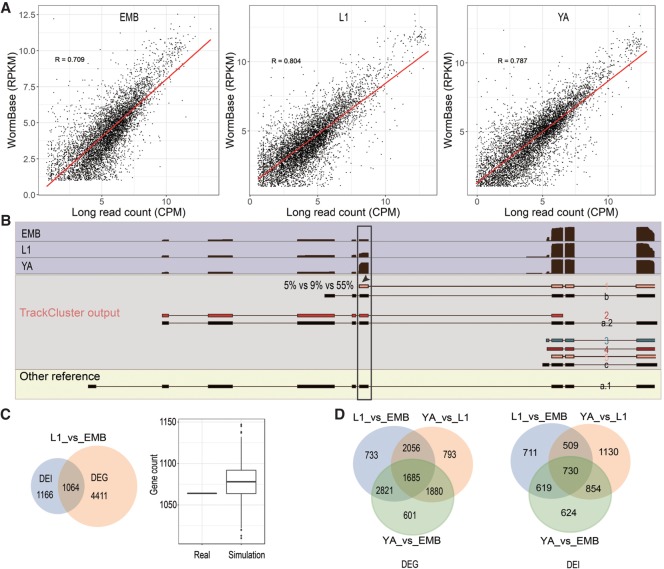
Relationship between expression at gene level and isoform level during development. (A) Correlations of expression at gene levels in three developmental stages determined by the long reads in this study and by the existing RNA-seq reads (WormBase release WS260). (B) An example of stage-specific abundance of TrackCluster predicted isoforms. Shaded in light blue is the coverage of long reads for gene efhd-1 over development. Existing (black) and TrackCluster predicted novel isoforms are shaded in gray. Novel isoforms are labeled as “1” to “5” and are colored as in Figure 2 and existing isoforms are labeled as “a”, “b,” or “c”. The existing isoform without any supporting long read is shown at the bottom. Note that the exon (indicated with arrowhead) with an elevated usage in young adult (55%) is highlighted in the black box. The elevation is produced by stage-specific expression of the isoform “1.” The abundance of the isoforms in EMB, L1, and YA is indicated (5%, 9%, and 55%, respectively). (C) Intersection of differentially expressed genes (DEG) and isoforms (DEI) between L1 and embryonic stages (L1_vs_EMB). Left: Venn diagram between DEG and DEI. Number of unique and shared genes are indicated. Right: Simulation of intersection between two sets of genes randomly chosen from the expressed genes either in L1 or embryos based on long reads. Number of genes sampled in each set is the same as that in DEG or DEI. (D) Venn diagrams showing the intersection of DEG (left) or DEI (right) among three stages.

