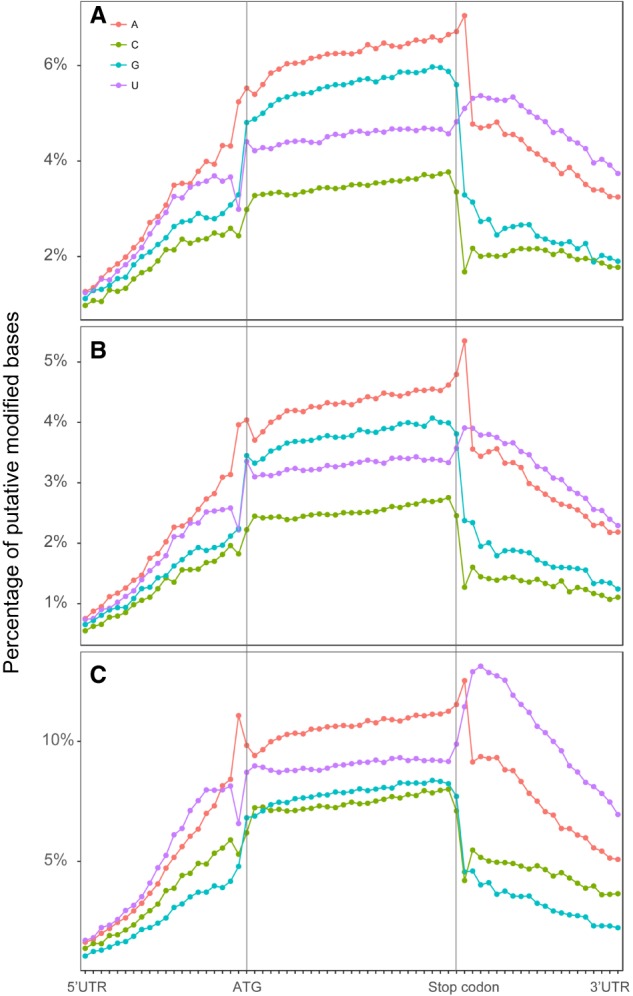
Figure 6.

Percentage of putative modified bases along the gene body in three developmental stages: (A) embryos; (B) L1 larvae; (C) young adults. Putative base modifications are predicted with Tombo (version 1.4) and are differentially colored as indicated. The “de novo” model is used to identify all potential modifications on each base. The fraction of modification at each site indicates the normalized percentage of a putative modification out of all available reads at this site.
