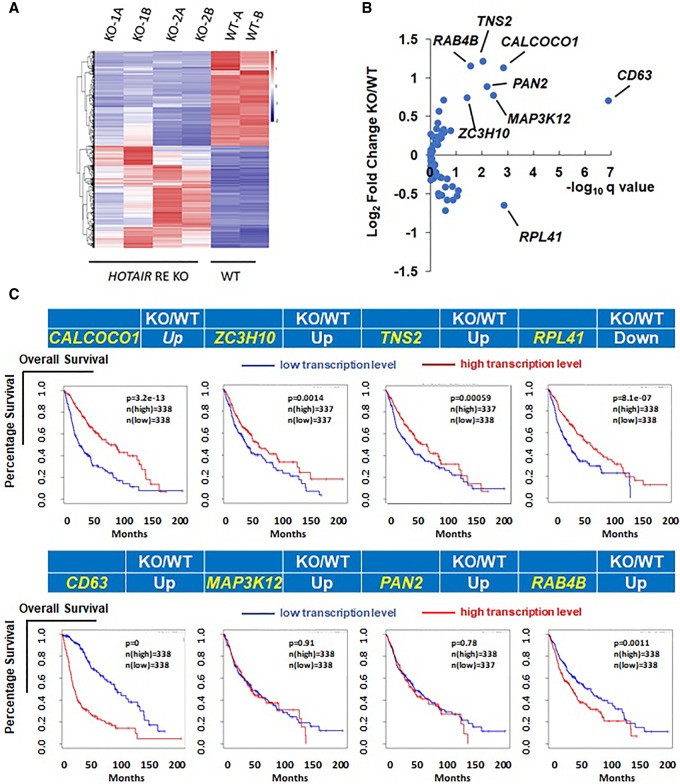
Figure 3.
Potential target genes regulated by the HOTAIR regulatory element. (A) Comparison of gene expression in HOTAIR regulatory knockout (KO) and wild-type (WT) glioma lines. Heat map shows clustering of differentially expressed genes in KO and WT glioma cells. KO-1A and B, KO-2A and B, WT-A and B refer to two biological replicates, respectively. (B) Comparison of fold-changes in gene expression based on RNA-seq data and corresponding Capture Hi-C signal. Eighty-nine potential target genes reproducible in two biological replicates are shown on the plot. Among them, eight with significant expression change between KO and WT (adjusted P-value < 0.05, and fold-change >1.5 or <−1.5) are marked with the gene name. (C) Shown are the eight target genes and associated survival data from glioma patients.

