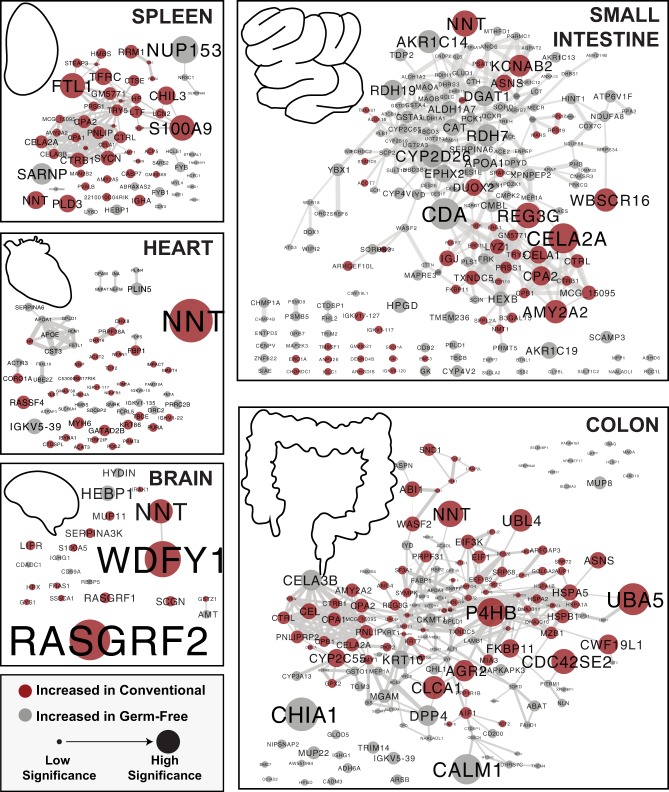
Figure 1.
Organ-specific protein networks modulated by microbial colonization. Proteins significantly increased in either GF or conventional animals were analyzed for interactions through STRINGdb. Edges in each node represent the combined score accounting for all interaction sources. The edges are sized by the combined score, with the minimum threshold being 0.4 (of a maximum confidence 1). Nodes represent gene names of significant proteins with a minimum statistical cutoff of |π| > 1. Red indicates a significantly higher presence in conventional mice and gray indicates the opposite. The nodes are sized by the level of significance as assessed by π-score.

