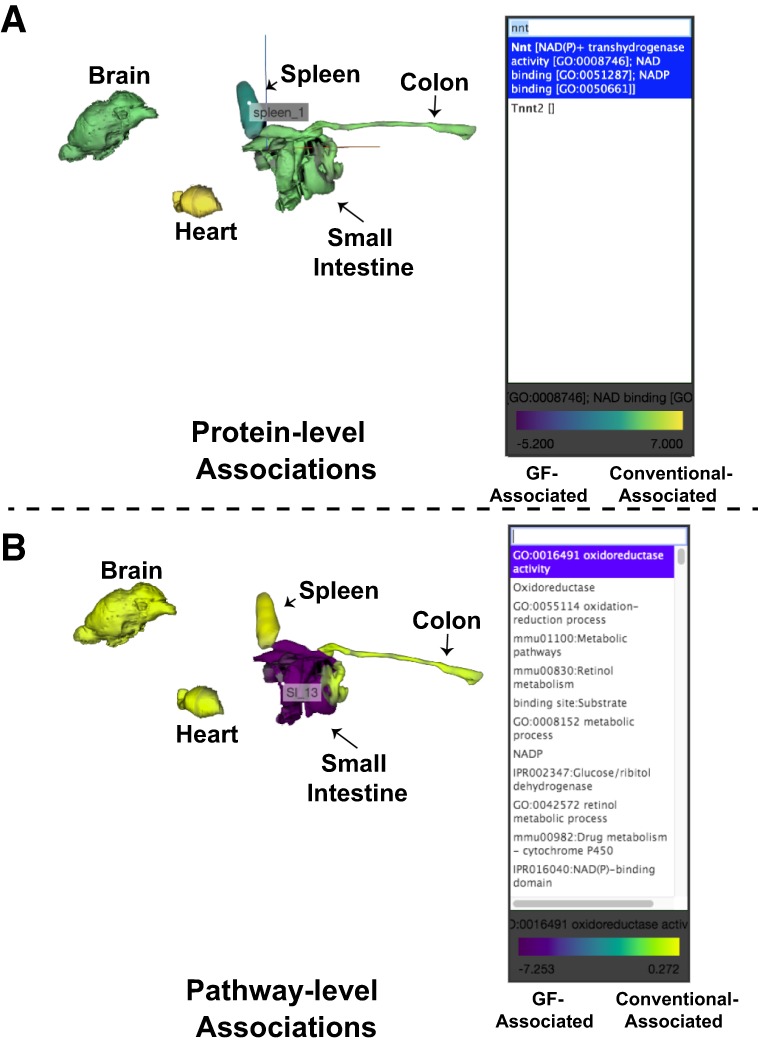
Figure 5.

Interactive 3D visualization of associations with colonization status. A 3D mouse model was generated for use on the web-based ‘ili platform (https://ili.embl.de/). (A) An example use case for the protein-level association visualizations shown through plotting the π-score enrichment for conventional colonization status. (B) An example use case for the pathway level association visualizations shown through highlighting the enrichment scores for “Oxidoreductase.” Pathway association scores were generated through –Log10(Benjamini–Hochberg corrected P-values) of the conventional organs minus the GF organs (from Supplemental Table S2).
