Figure 2.
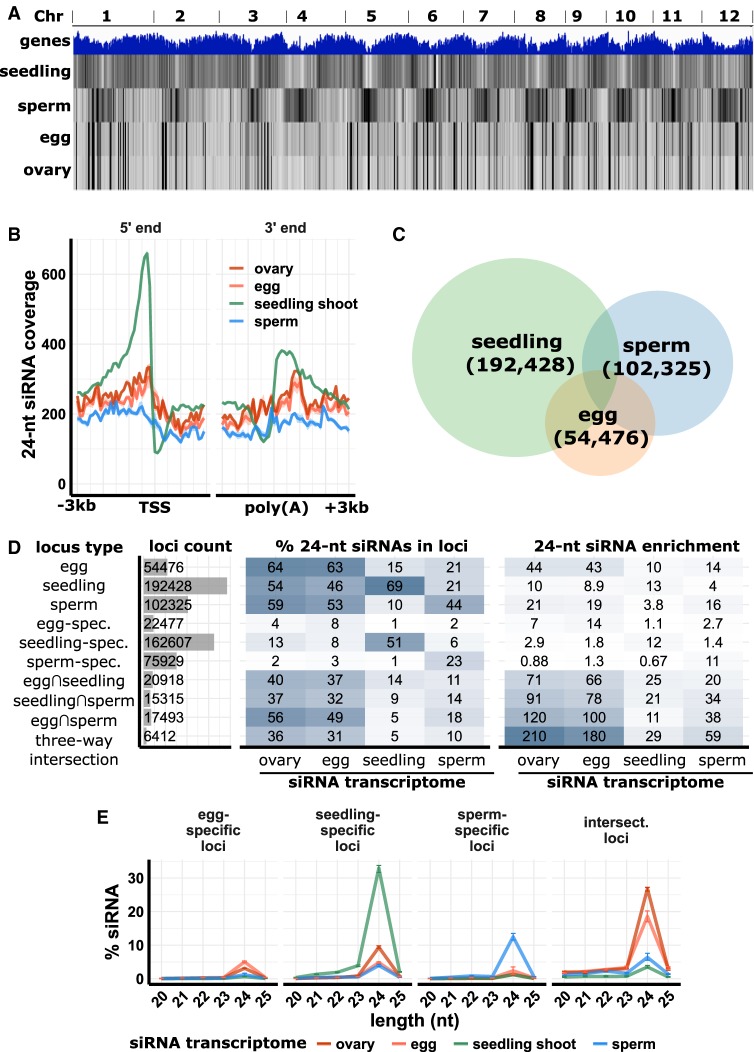
siRNA distributions in ovary, egg cell, sperm cell, and seedling shoot. (A) Whole-genome 24-nt siRNA heat maps. Top track: gene density; second to fifth tracks: 24-nt siRNAs from seedling shoot, sperm cell, egg cell, and ovary. (B) Metagene coverage plot for 24-nt siRNAs. Coverage is measured over 100-bp intervals and normalized per 1000 total siRNAs. Vertical grid lines indicate 500-bp intervals. (TSS) Transcription start site, (poly[A]) polyadenylation site. (C) Venn diagram showing number and overlap of 24-nt siRNA loci. The genome was divided into 100-bp intervals and categorized as 24-nt siRNA loci based on coverage of 24-nt siRNAs from seedling shoot, sperm cell, and egg cell. (D) Number of 24-nt siRNA loci and abundance and enrichments of siRNAs from each tissue. Abundance (% 24-nt siRNAs in loci) is the number of 24-nt siRNAs that overlapped with the loci relative to the total number of 24-nt siRNAs from the tissue. Enrichment is the abundance normalized by the number of 24-nt loci. In locus types, “spec.” is short for “specific,” the set of loci only identified from a single tissue. (E) siRNA abundance at 24-nt siRNA loci. “Intersect.” refers to intersection loci, those identified as 24-nt siRNA in all three tissues. y-axis values are percent of siRNAs of each length relative to the total number of siRNAs that mapped to the genome. Error bars are 95% confidence intervals based on biological replicates of each tissue.

