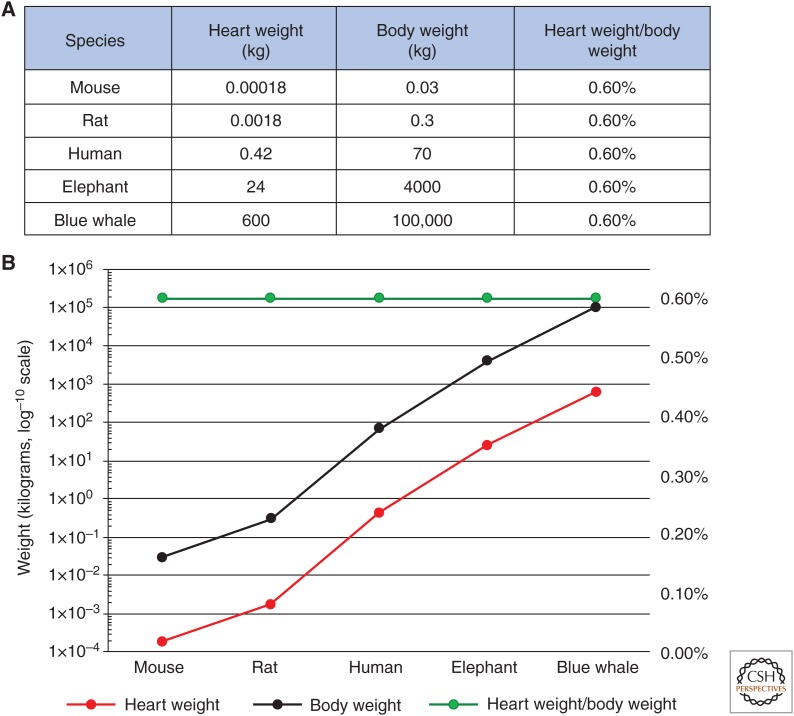
Figure 1.
Total organism mass and heart mass of selective mammalian species. (A) Heart and total body weights (kg) and heart weight/total body weight ratios of indicated mammalian species. (B) Graphical representation of A. Secondary y axis plots heart weight/total body weight ratio percentages. (Panels created from data in Dobson 2003.)

