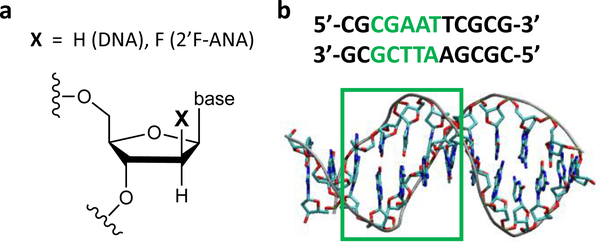
Fig. 1.
Schematic representation of the molecular systems studied. (a) Modification of the DNA sugar moiety that produces 2’F-ANA. (b) Molecular structure and nucleobase pair sequence of the Dickerson-Drew dodecamer (PDB: 4C6453). The CT analysis is performed on the sequence portion highlighted in green. The A-T base pairs in the 5’-to-3’ direction are denoted A1T, A2T, and TA.

