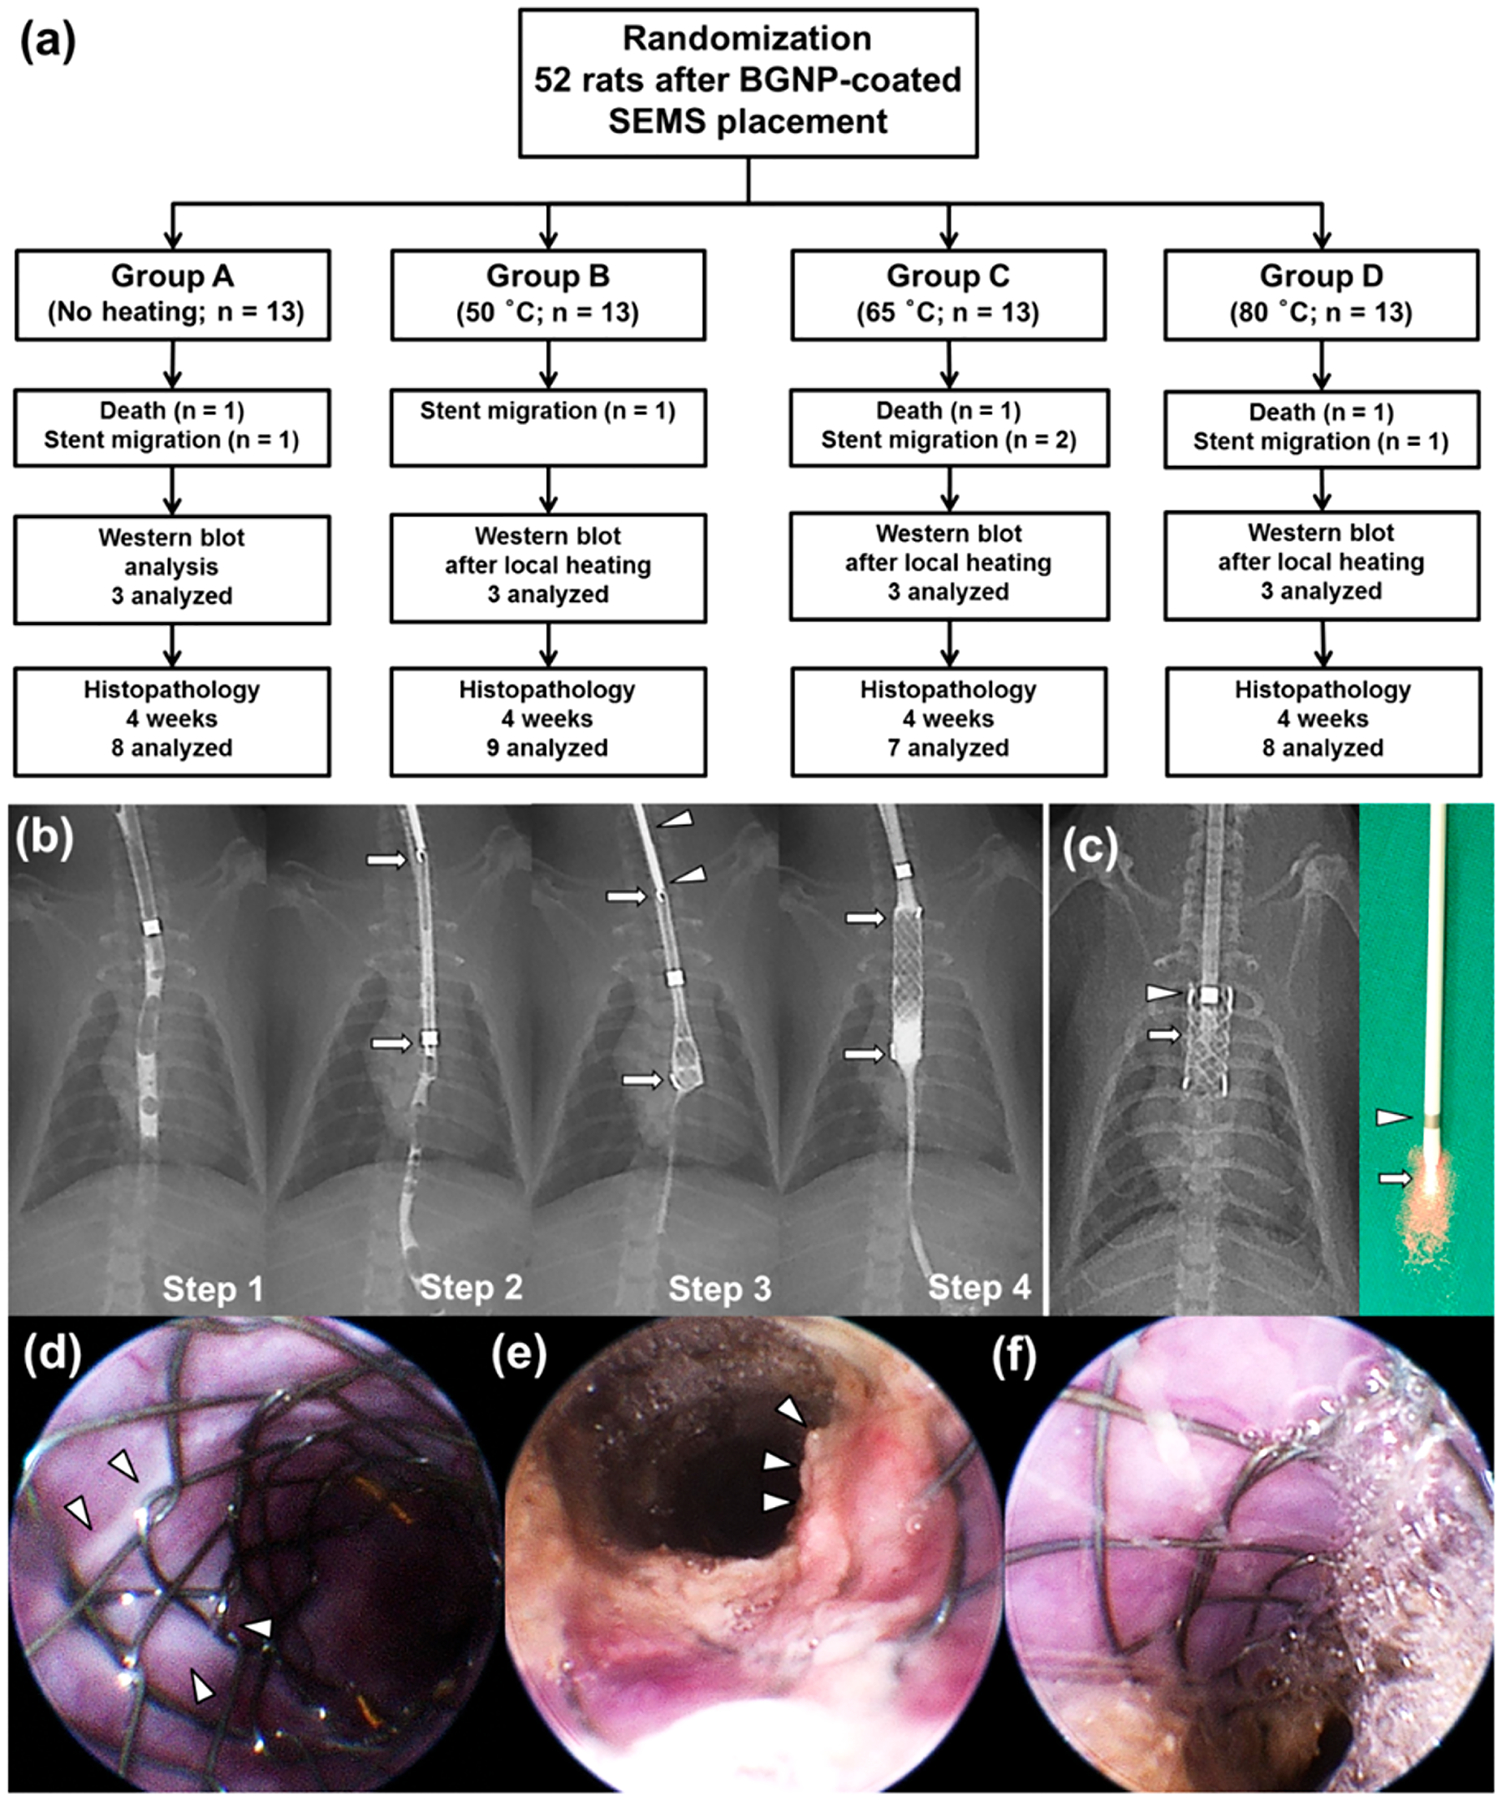
Figure 3.

(a) Flow diagram and study design showing the randomization process and follow up. (b) Radiographic images showing the technical steps of stent placement in a rat esophageal model. Step 1, preprocedural esophagography was performed to determine the location of stent placement in the esophagus; step 2, radiograph showing a compressed stent in a 6-Fr sheath (arrows); step 3, the compressed stent (arrows) was loaded in the sheath and placed using a pusher catheter (arrowheads); step 4, postprocedural esophagography was performed immediately to verify the position and patency of the stent (arrows). (c) Radiographic and digital images of the fiber optic NIR probe advanced through the mouth into the middle portion of the stented esophagus. In vivo endoscopic image obtained (d) immediately after local heating in group B showing white tissue changes (arrowheads) around the stent wire. (e) Endoscopic image obtained 4 weeks after stent placement in group A showing relatively severe tissue hyperplasia through the wire mesh (arrowheads) compared to (f) group B.
