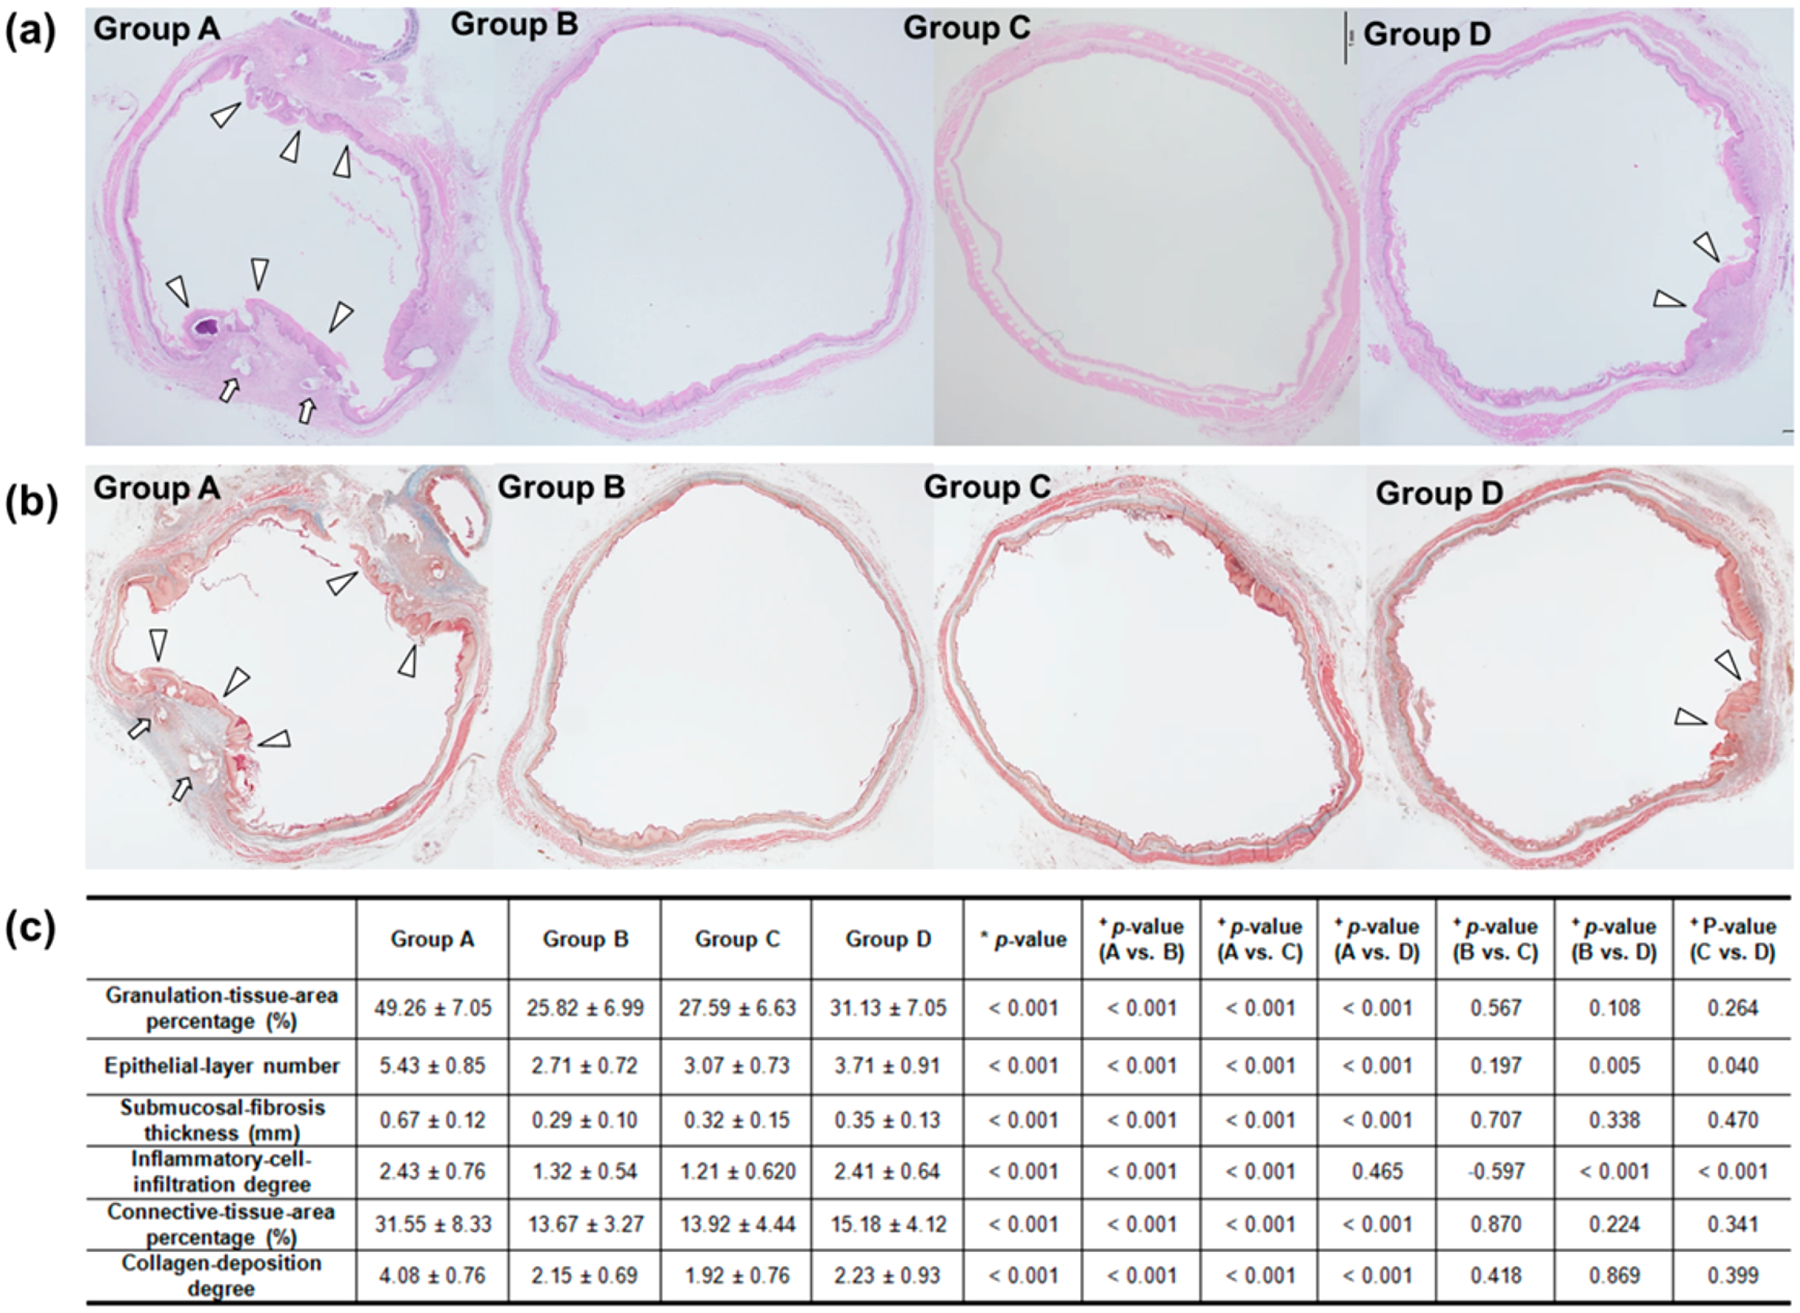
Figure 4.

Representative microscopic images of histological sections obtained 4 weeks after stent placement. (a) Hematoxylin and eosin and (b) Masson’s trichrome staining of groups A, B, C, and D. Arrows, stent struts; arrowheads, stent-induced granulation tissue (magnification ×1.25). (c) Table of the histological findings of each group. Note: Data are presented as mean ± standard deviation. (*Kruskal–Wallis test. +Mann–Whitney U test.)
