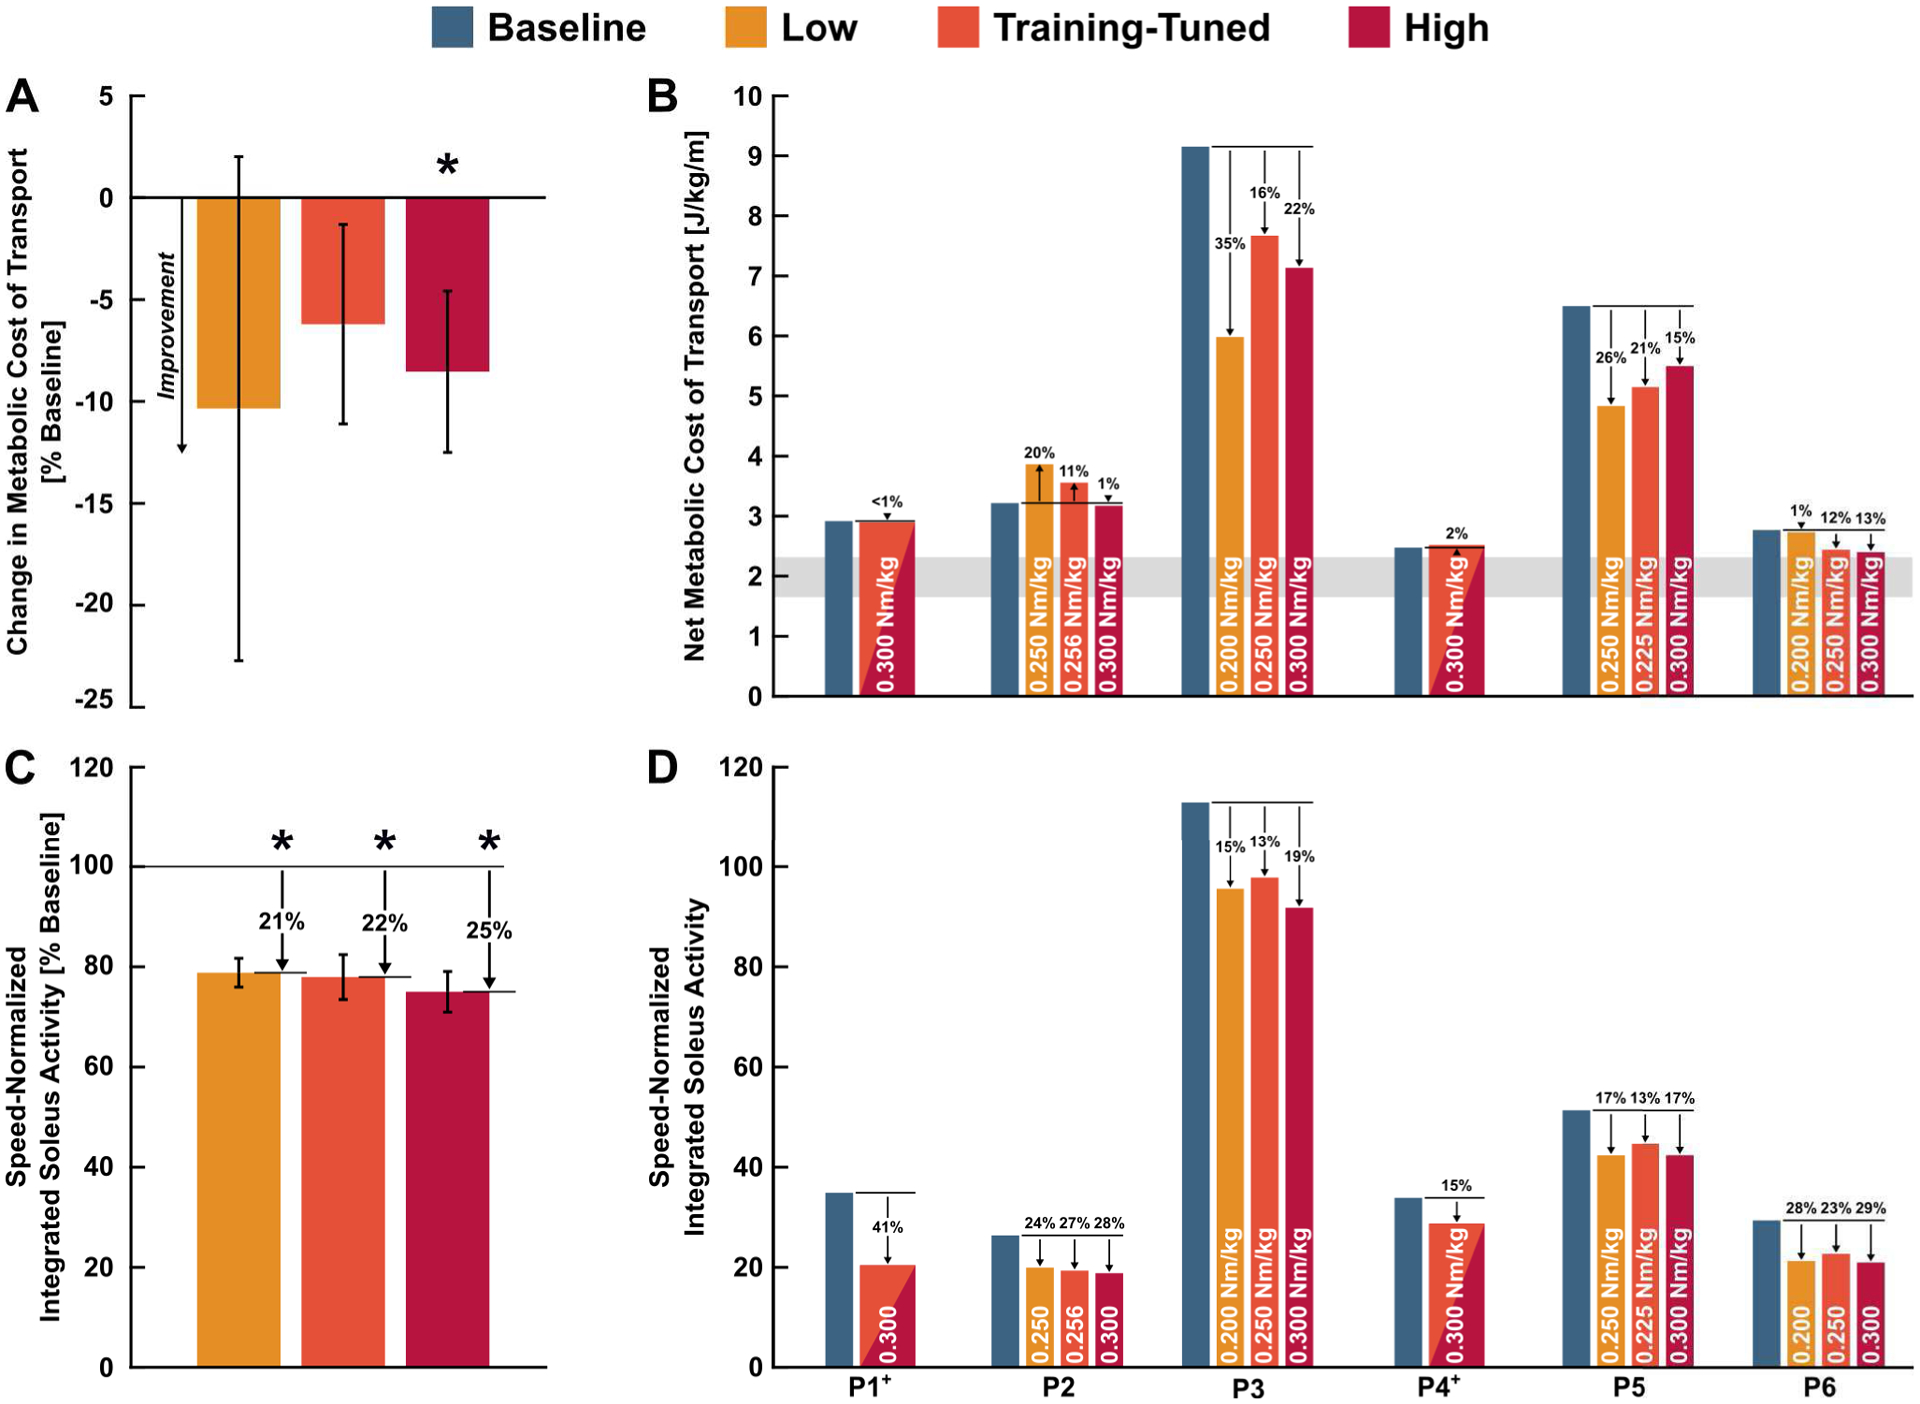
Fig. 2.

Comparison of net metabolic cost of transport (top) and soleus muscle activity (bottom) across baseline and assisted over-ground walking conditions. Average ± standard error. * indicates a significant reduction relative to baseline at 95% confidence. White text indicates torque level. (A) Change in group level metabolic cost of transport for low, training-tuned, and high assistance conditions relative to baseline. (B) Participant level net metabolic cost of transport. Gray bar indicates typical range of net metabolic cost of transport reported for unimpaired individuals from 9 years old to adulthood [28]. (C) Change in group level speed-normalized integrated soleus muscle activity for low, training-tuned, and high assistance conditions relative to baseline. (D) Participant level speed-normalized integrated soleus muscle activity. + For P1 and P4, the supplemental visit results were included in both training-tuned and high condition analyses, but not in the low condition analysis.
