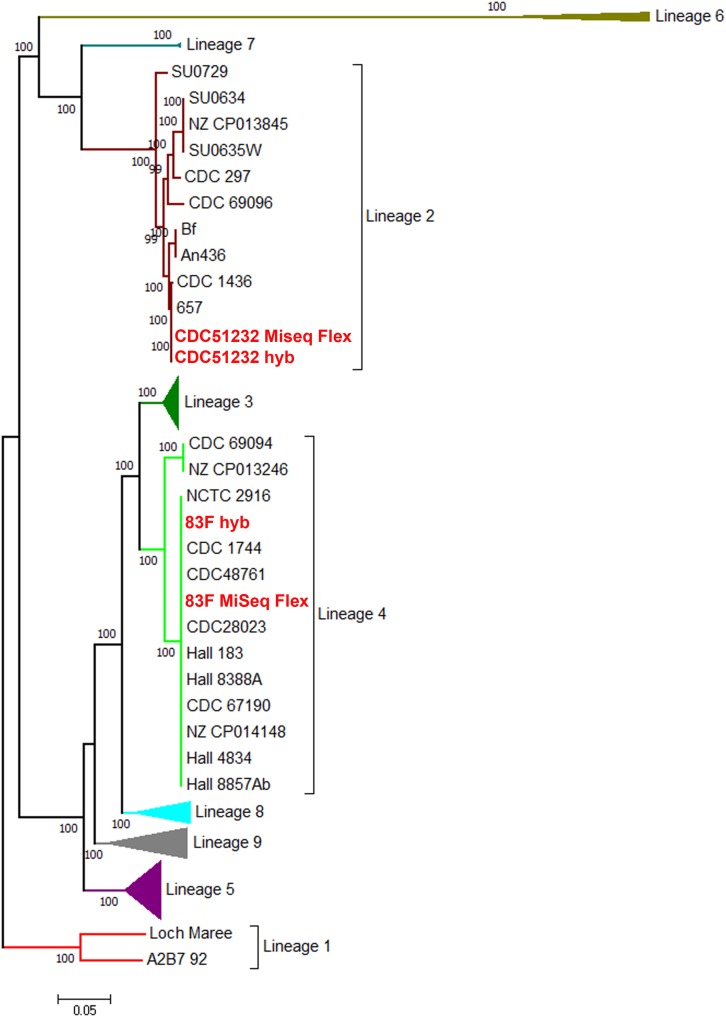
FIGURE 3.
Maximum likelihood phylogeny of C. botulinum Group I from a 117,944 bp core SNP matrix. The evolutionary history was inferred by using the maximum likelihood method based on the Kimura two-parameter model (Kimura, 1980). The tree shown has most of the lineages compressed for visualization purposes. The original tree with the highest log likelihood is shown in Supplementary Figure S1. Strains are listed in Supplementary Table S1. Bootstrap supports above 50% are shown above the branches. In red fonts are the strains sequenced in this study. The tree is drawn to scale, with branch lengths measured in the number of substitutions per site. Evolutionary analyses were conducted in MEGA7 (Kumar et al., 2016).

