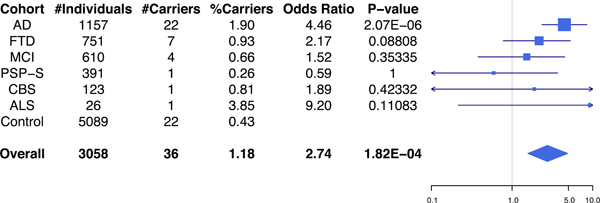
Figure 1: TREM2p.R47H carrier frequencies and associated odds ratios for the different disease series.

Total number of individuals and TREM2 p.R47H carriers for each disease series and control group is shown in the table (left), with odds ratios and P-values represented in the forest plot (right). AD: Alzheimer’s disease, FTD: frontotemporal dementia, MCI: mild cognitive impairment, PSP-S: progressive supranuclear palsy syndrome, CBS: corticobasal syndrome, ALS: amyotrophic lateral sclerosis. Overall refers to the combined neurodegenerative disease patient samples. In the forest plot, squares are drawn proportional to the number of samples in each series, and lines represent 95% confidence intervals.
