
Figure 4:
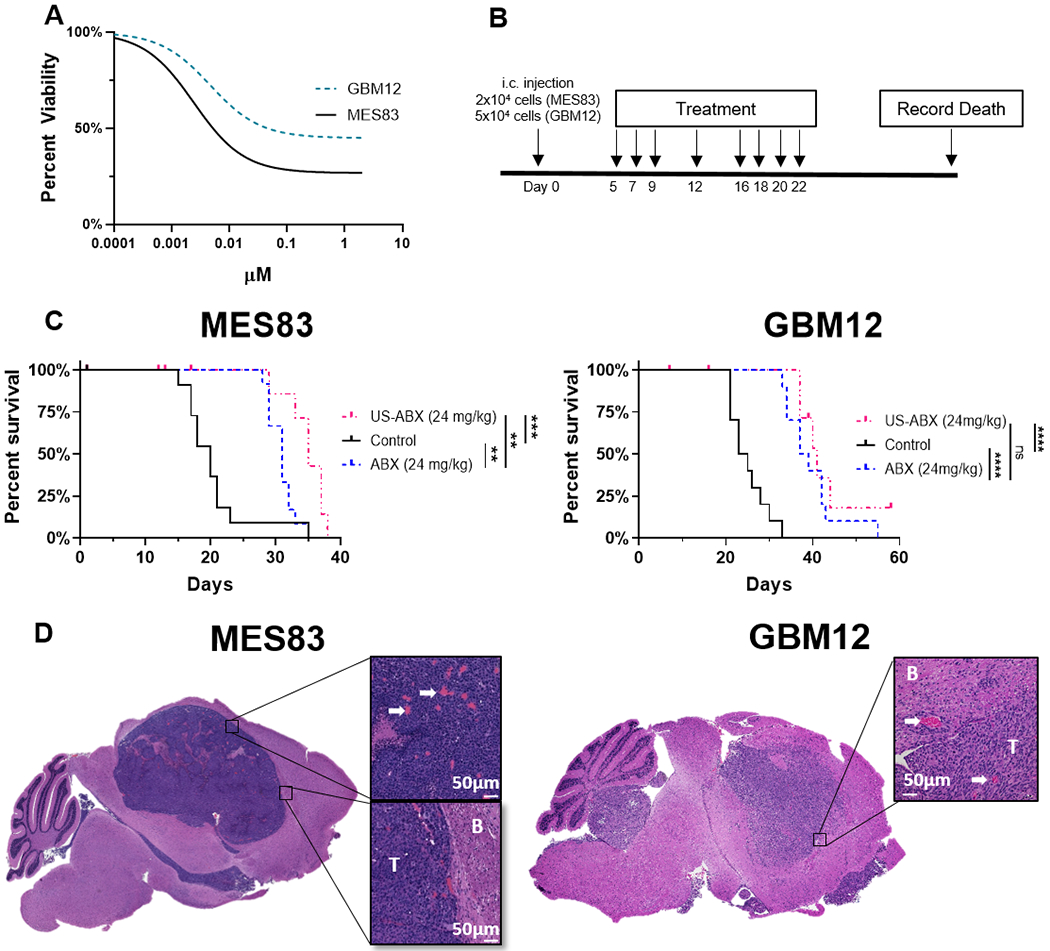
Ultrasound delivered ABX differs in therapeutic profile between two patient-derived xenograft models (A) Cell viability: GBM12 and MES83 short term explant cultures were exposed to increasing doses of ABX, viability after 72 hours was determined by CellTiterGlo. Dose response curves represent three replicates. (B) Experimental timeline. (C) Five days after tumor implantation, mice were randomized to treatment groups as indicated and survival is plotted through Kaplan-Meier graphs. Survival differences were determined through log-rank analysis. Mice that did not die due to tumor burden were censored from this analysis. Censored subjects are denoted by tick mark on the day they were removed from the study. (MES83: **p=0.0041, **p=0.0036, ***p=0.0006) (GBM12: ****p<0.0001, ns (p=0.2590), ****p<0.0001) (D) H&E stain of tumor histology from untreated control mice. Left, MES83 xenograft. Right, GBM12 xenograft. White arrows show blood vessels. B, Brain tissue; T, Tumor mass. White scale bar, 50μm.