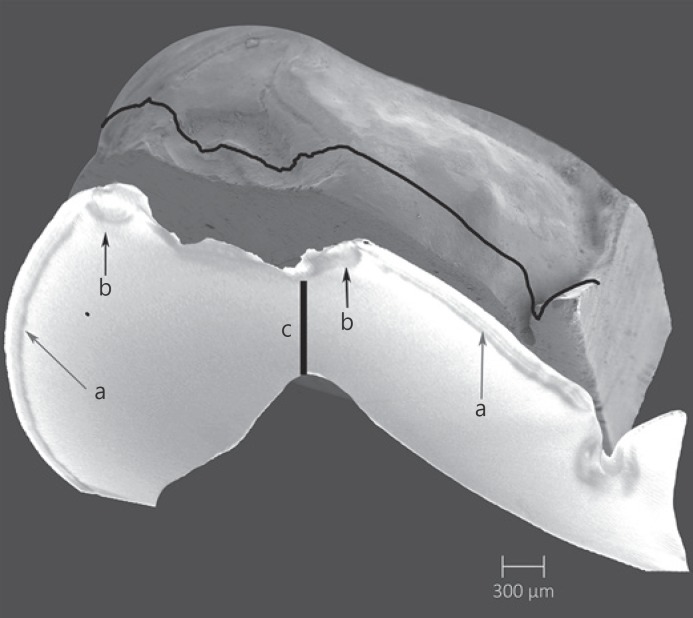
Fig. 5.
Representative specimen from the pH 4.8/50N group. Top view is an SEM image (magnification, ×50) and underneath a µCT image slice at the cross-section indicated by the line: (a) indicates surface demineralization, (b) damaged enamel near the cusp tip, and (c) the remaining enamel between the bottom of the cup-shaped lesion and the dentine “cusp” tip.

