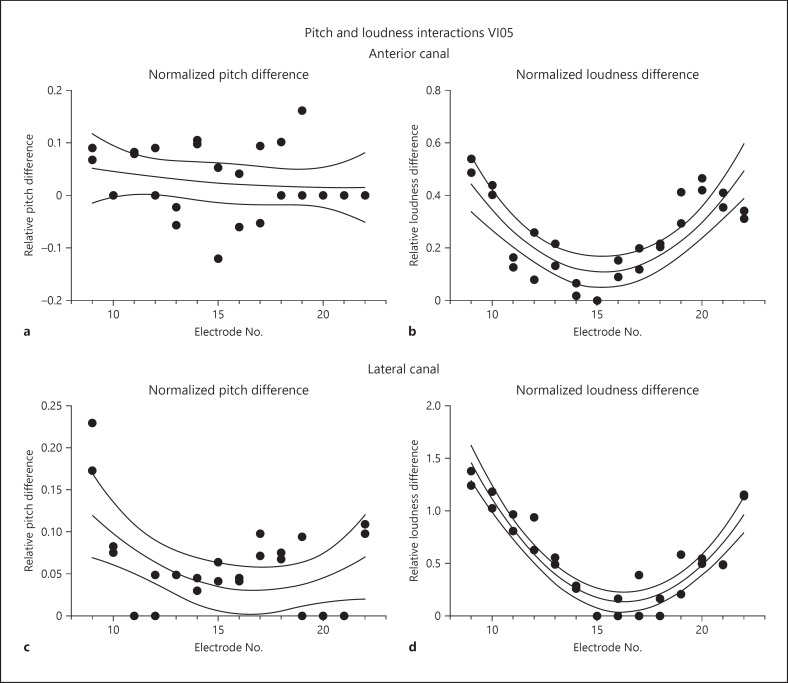
Fig. 8.
Pitch and loudness interactions comparing stimulation of a cochlear array site alone with a combination of stimulation of that site with the interleaved stimulation of the distalmost site on the anterior or lateral canal array at threshold for perceived motion in VI05. All graphs plot individual perceptual judgments fit by a second-order polynomial and bounded by the 95% confidence interval of the fit. a Normalized perceived pitch differences between cochlear stimulation alone and cochlear stimulation with interleaved vestibular anterior canal array stimulation. b Normalized perceived loudness differences between cochlear stimulation alone and cochlear stimulation with interleaved vestibular anterior canal array stimulation. c Normalized perceived pitch differences between cochlear stimulation alone and cochlear stimulation with interleaved vestibular lateral canal array stimulation. d Normalized perceived loudness differences between cochlear stimulation alone and cochlear stimulation with interleaved vestibular lateral canal array stimulation. Positive values indicate an increase in perceived pitch or loudness with combined stimulation, and negative values indicate a decrease. Electrode number on the cochlear array is indicated by the values on the abscissa of each graph. A value of 1.0 on the ordinate of either graph corresponds to the maximum difference for a given measure between any two electrodes on the cochlear array for subject VI05.

