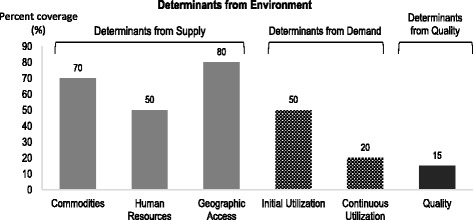
Fig. 1.

Graphical presentation of the determinants analysis framework. Description of figure: The figure describes the supply side, demand side and effective coverage determinants and how bottlenecks are determined

Graphical presentation of the determinants analysis framework. Description of figure: The figure describes the supply side, demand side and effective coverage determinants and how bottlenecks are determined