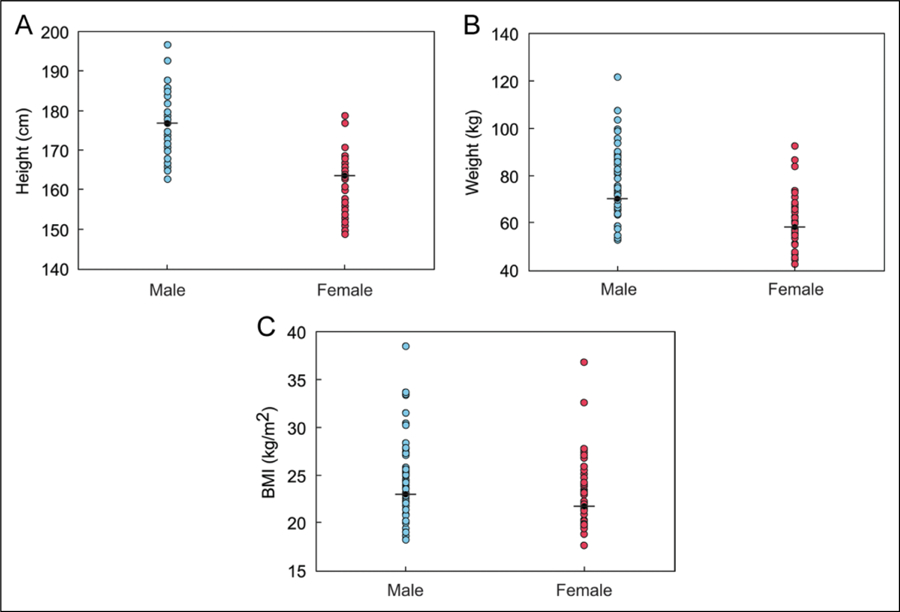
Figure 2.

Absolute values of (A) height, (B) weight, and (C) BMI of the cohort ≥20 years. The black line represents the mean value of the normal population at 20 years of age per the CDC.24 BMI indicates body mass index; CDC, Centers for Disease Control and Prevention.
