
Fig. 2.
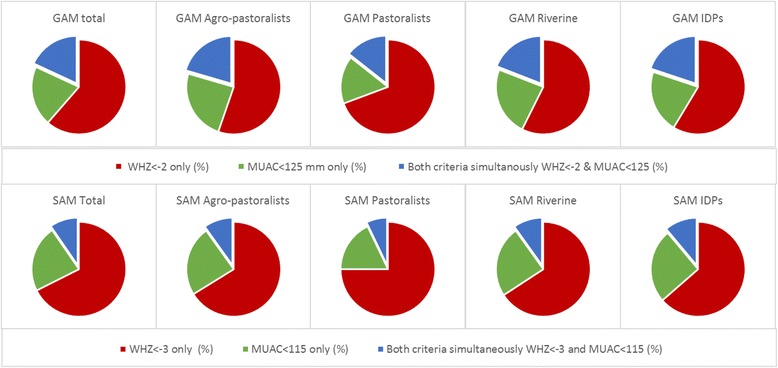
Comparison of acute malnutrition diagnosis by WHZ and/or absolute MUAC in four Somalian livelihoods. Proportion of acutely malnourished children that are diagnosed as such (GAM first row and SAM second row) either by WHZ alone (red), by absolute MUAC alone (green) or by both WHZ and absolute MUAC (green), for the total population and by the four livelihood populations in Somalia