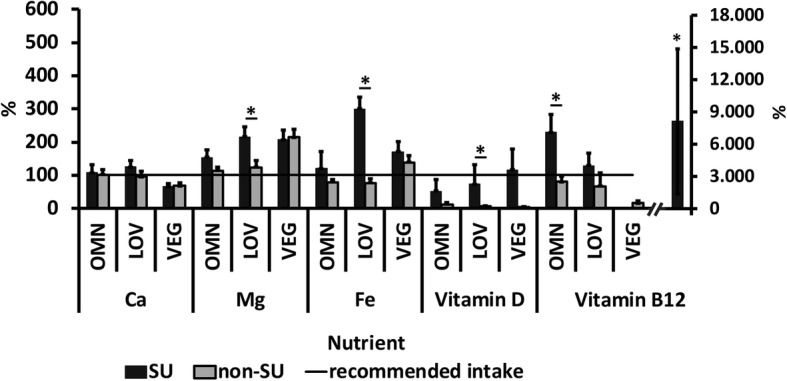
Fig. 3.

Nutrient intake in relation to the reference range: SU vs. non-SU (females; mean + SD). Recommended intake of the D-A-CH [33]. The error bars represent the standard deviations of the average daily nutrient intake. Differences between SU and non-SU were analyzed using the Mann-Whitney U test. *p ≤ 0.05
