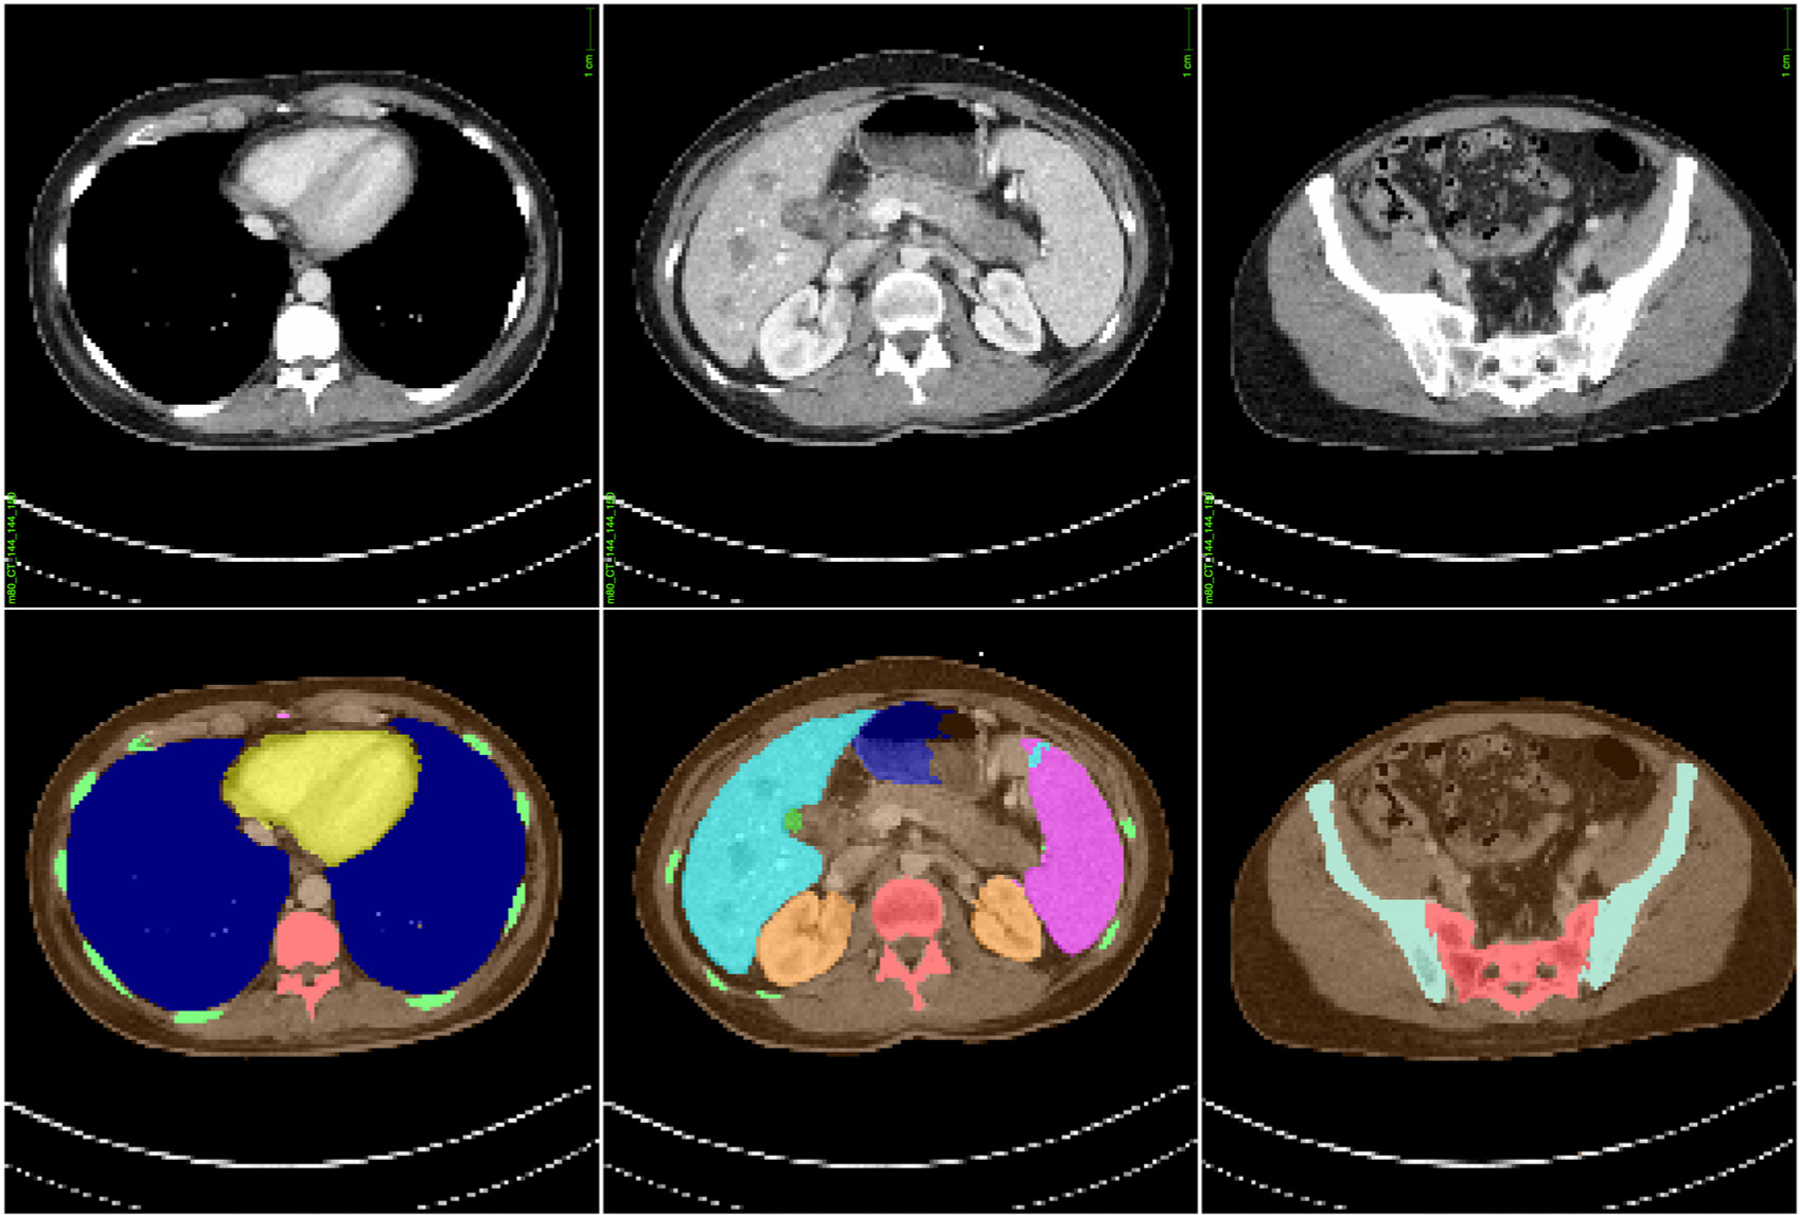
Figure 3.

Sample slices from the CAP CT image dataset (top) for one of the patients used in this study along with corresponding masks (bottom) for automatically segmented organs used for generating models of patient-specific anatomy. The models constructed from imaging datasets of the patient population were simulated with the MC tool developed in this study to demonstrate a framework for individualized dose estimations in CT.
