
Figure 4.
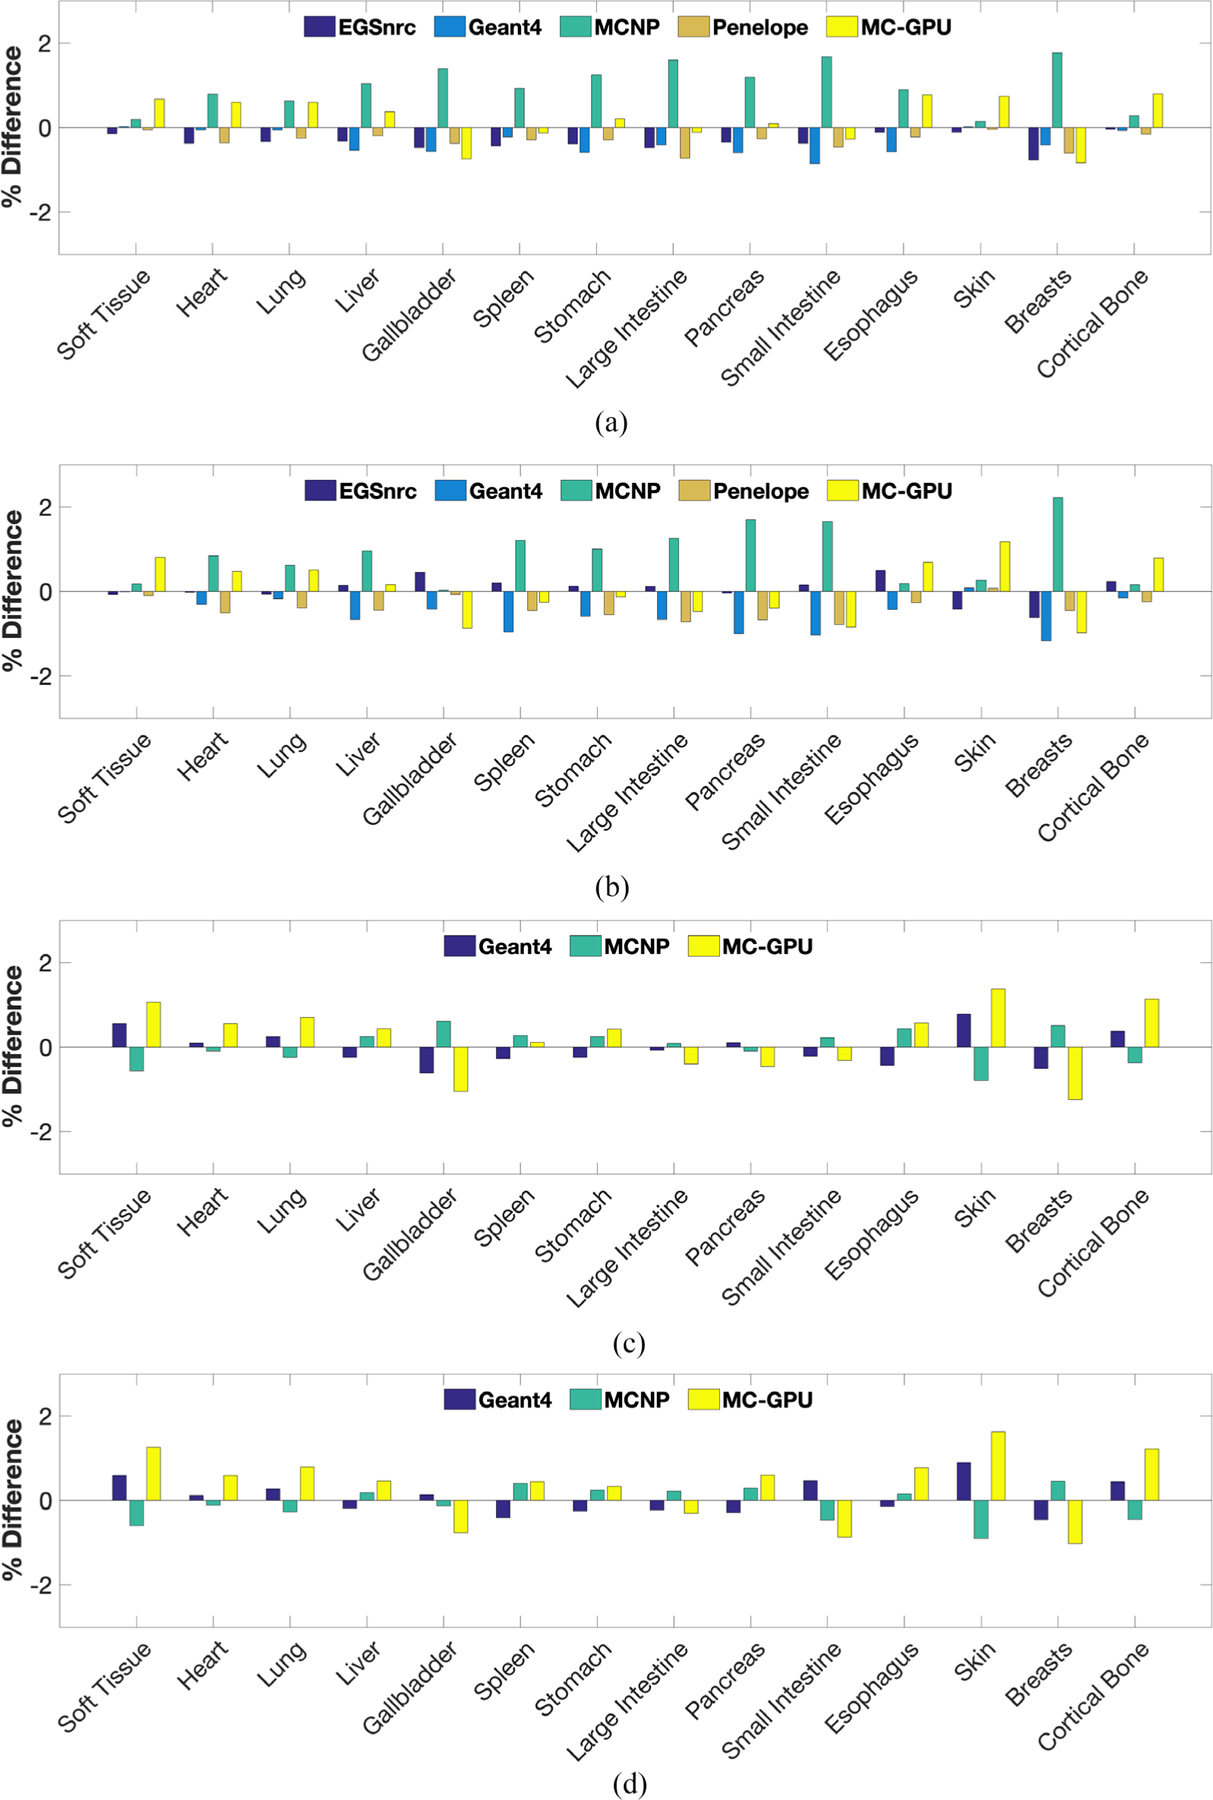
Percentage difference between the energy deposited per photon in different organs as estimated by the various MC packages (EGSnrc, Geant4, MCNP, Penelope and MC-GPU) and the mean energy deposition value as reported by AAPM’s TG-195. The percentage differences for thyroid, thymus and adrenals were excluded from the plot due to space constraints. (a) Source configuration: discrete, 56.4 keV (monoenergetic); projection Angle: 0°. (b) Source configuration: discrete, 120 kV (Bremsstrahlung); projection Angle: 0°. (c) Source configuration: random, 56.4 keV (monoenergetic). (d) Source configuration: random, 120 kV (Bremsstrahlung).