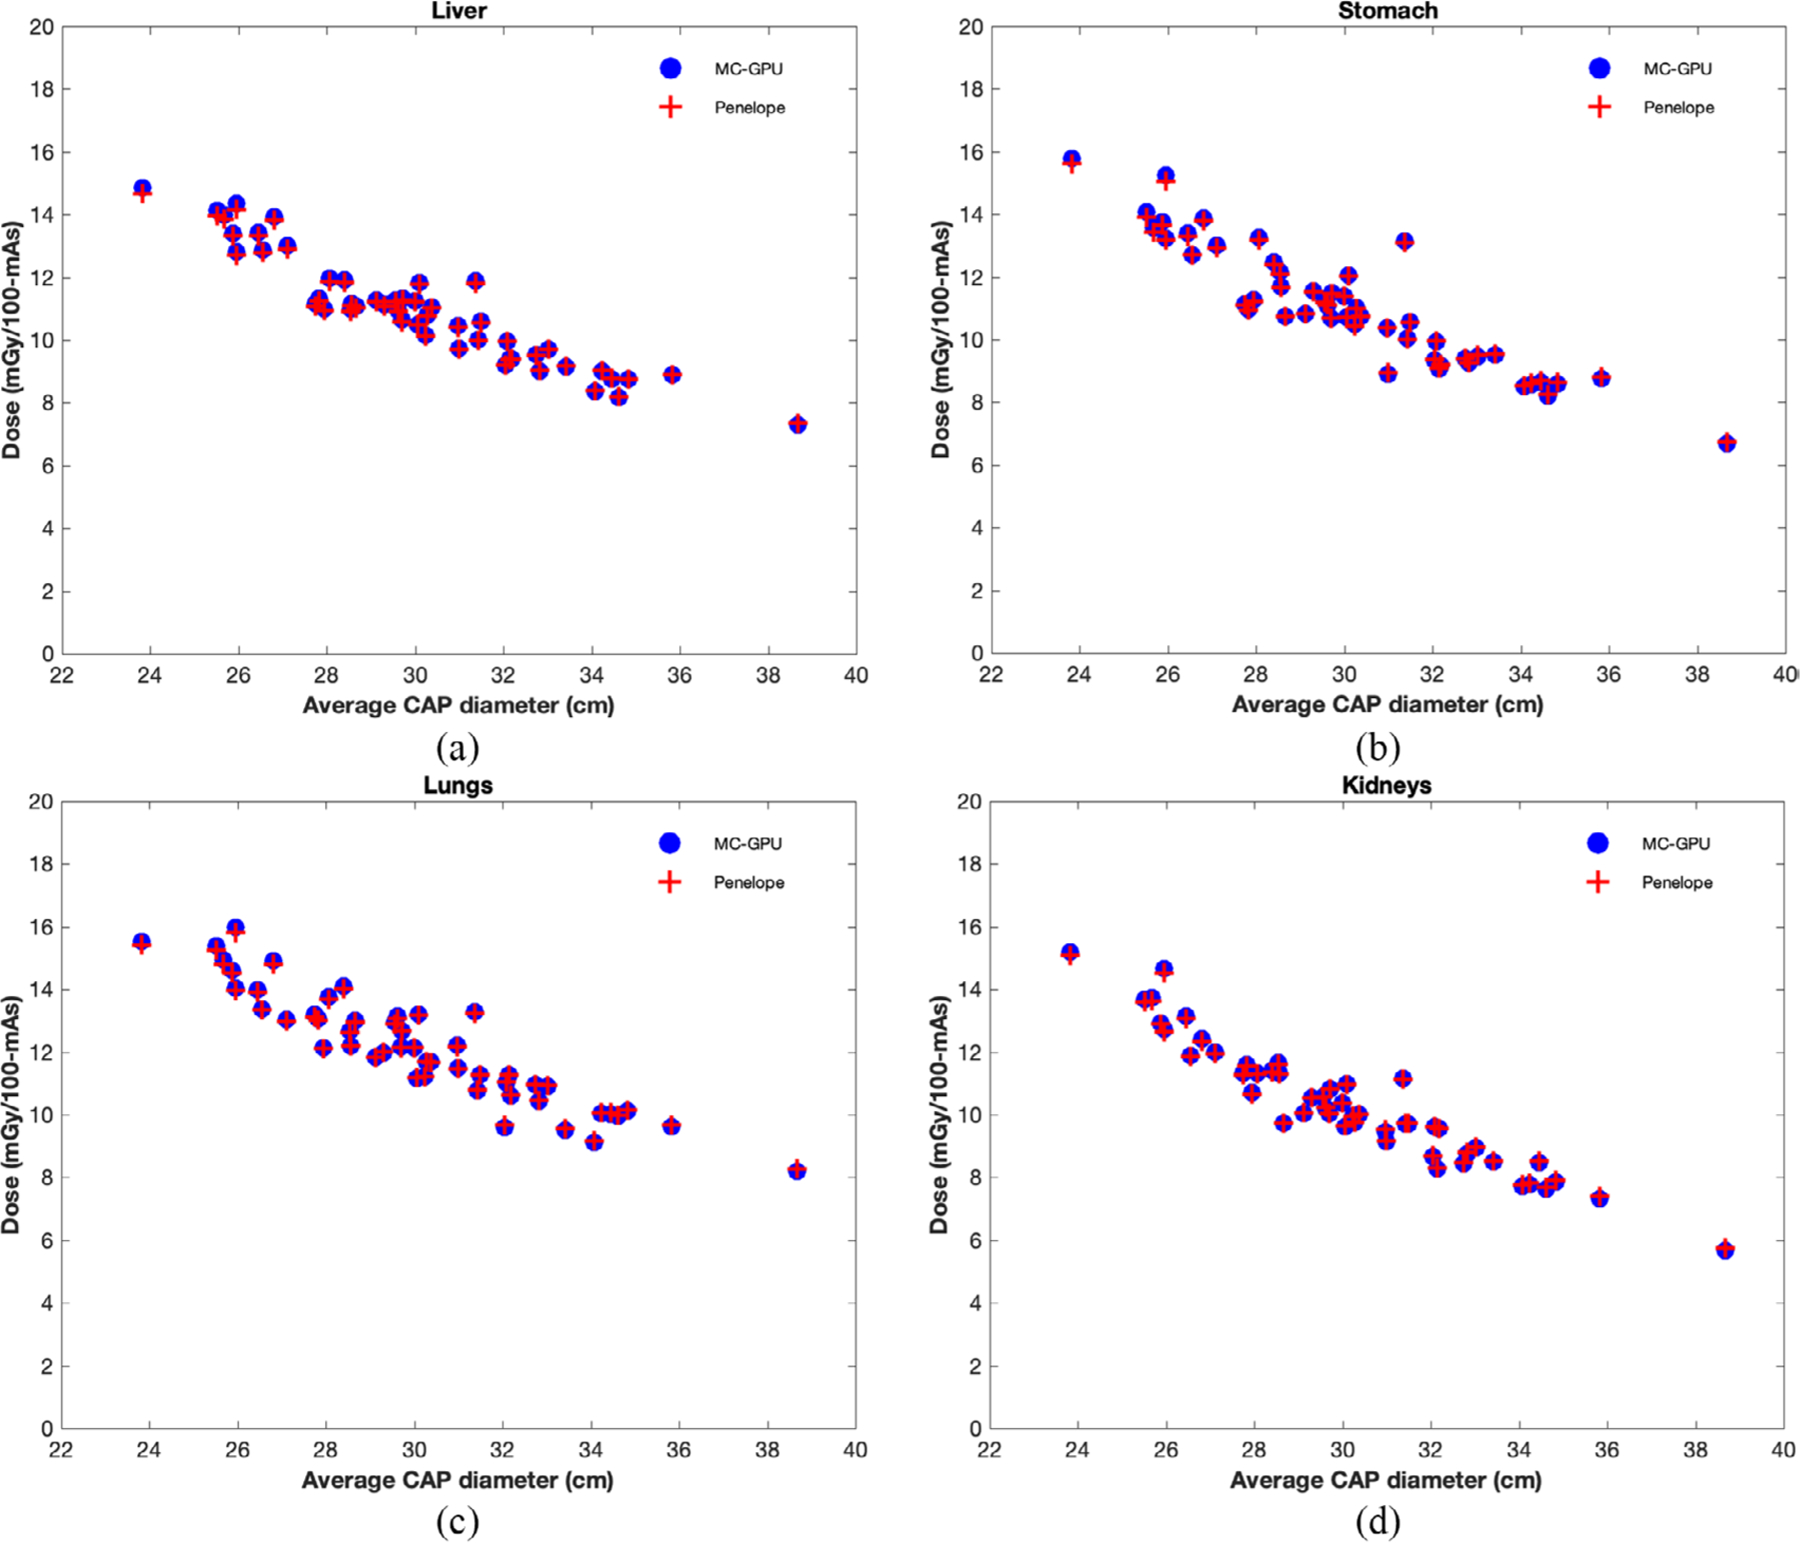
Figure 6.

Individualized organ dose estimates (in units of mGy/100 mAs) plotted against average CAP diameter for a select population of 50 adult patient models simulated using a clinical CAP protocol. The dose estimates from the GPU-based MC tool proposed in this study were also compared to estimates from a previously validated tool based on Penelope as an additional validation step.
