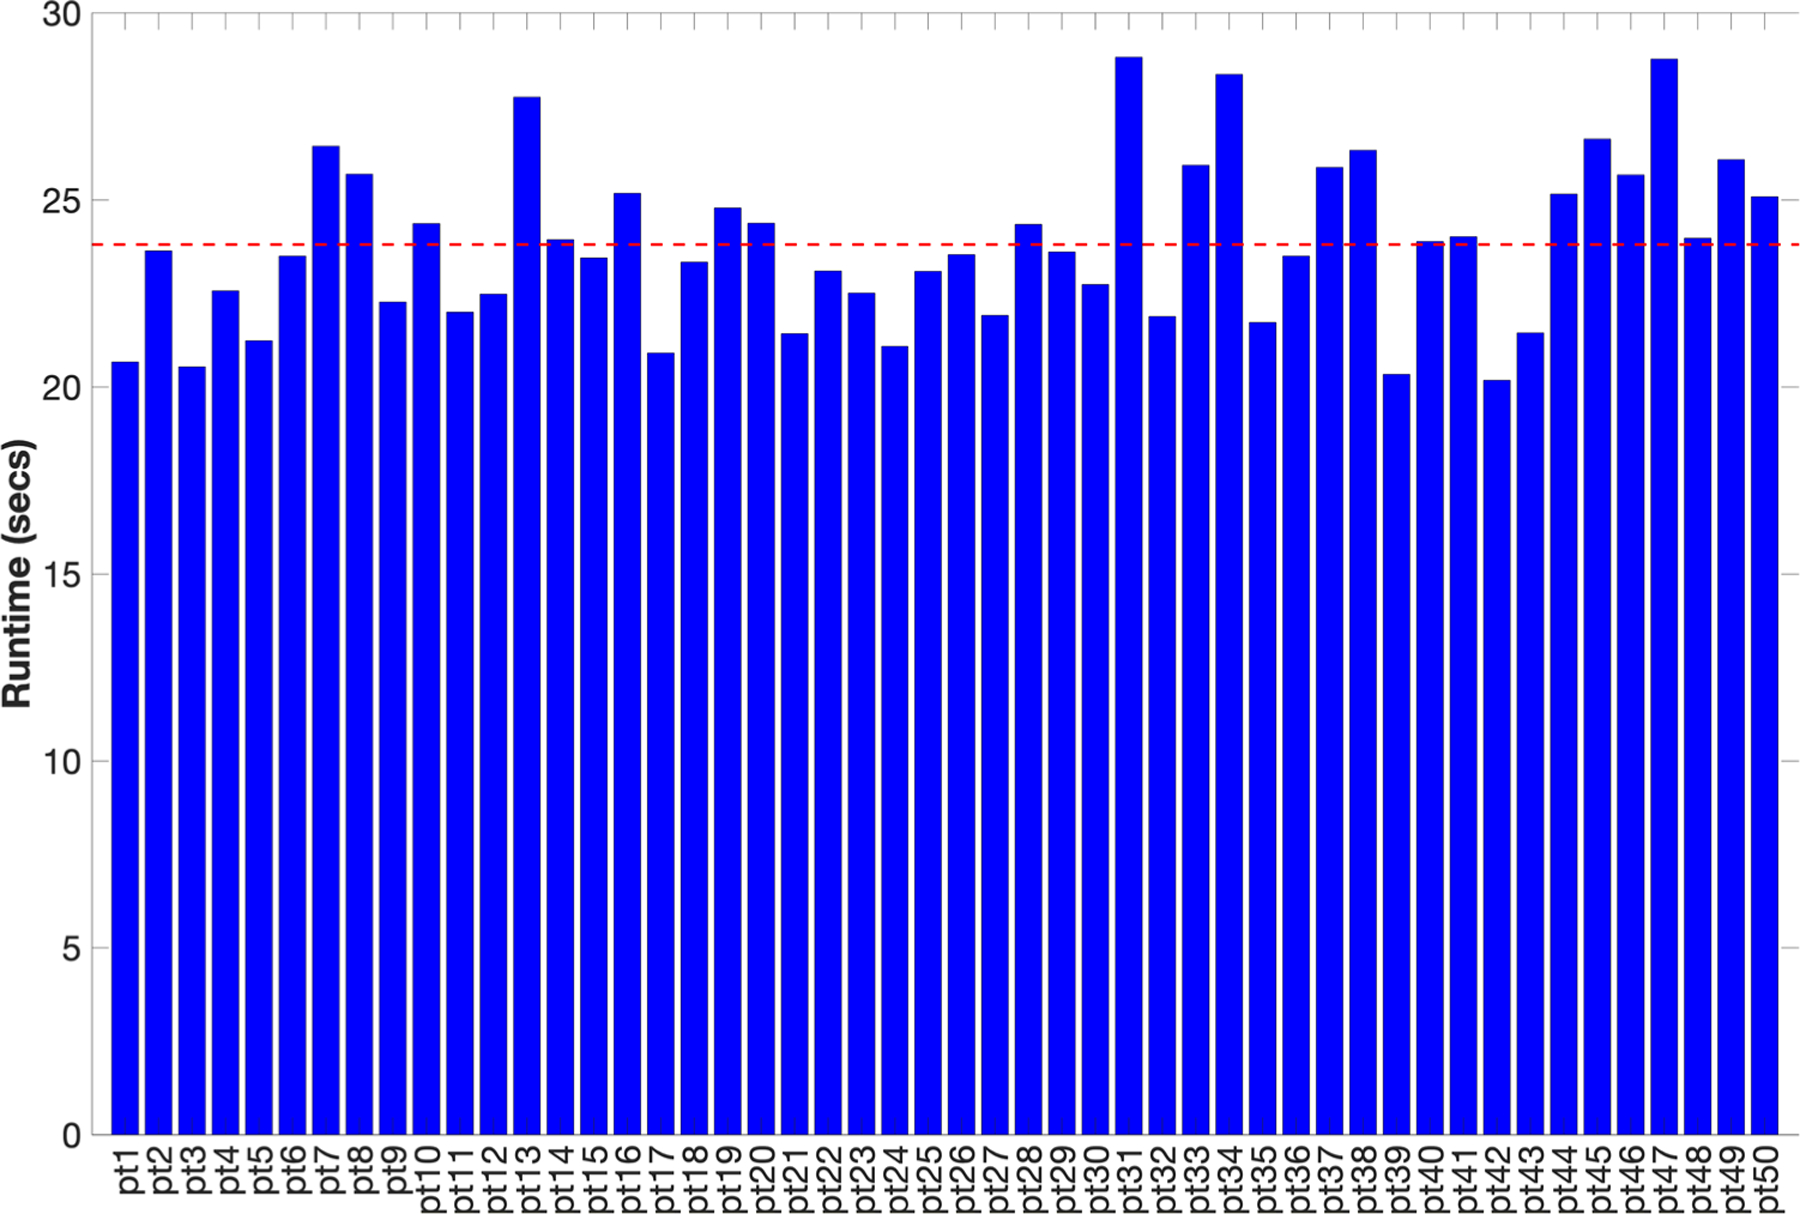
Figure 7.

Run durations (in seconds) for simulating a clinical CAP protocol for all 50 patients in the patient population used for this study. The horizontal red line represents the runtime averaged across all patients, which was used for the speedup computation summarized in table 3.
