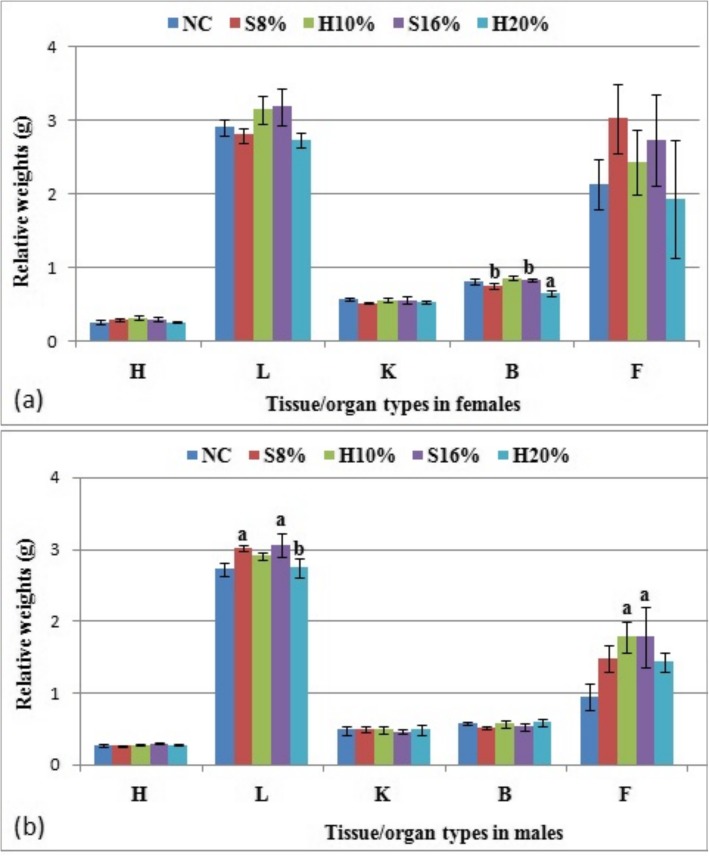
Fig. 4.
Relative tissue/organ weights (g) of female (a) and male (b) rat groups fed natural honey and table sugar sweetened diets respectively. H = Heart, L = Liver, K = Kidneys, B = Brain and F = Fat. NC = normal control, S8% = 8% sugar sweetened diet group, S16% = 16% sugar sweetened diet group, H10% = 10% honey sweetened diet group and H20% = 20% honey sweetened diet group. a = P < 0.05 vs. NC and b = P < 0.05 vs. corresponding energy groups. Values represent the means ± SEM, n = 3–5

