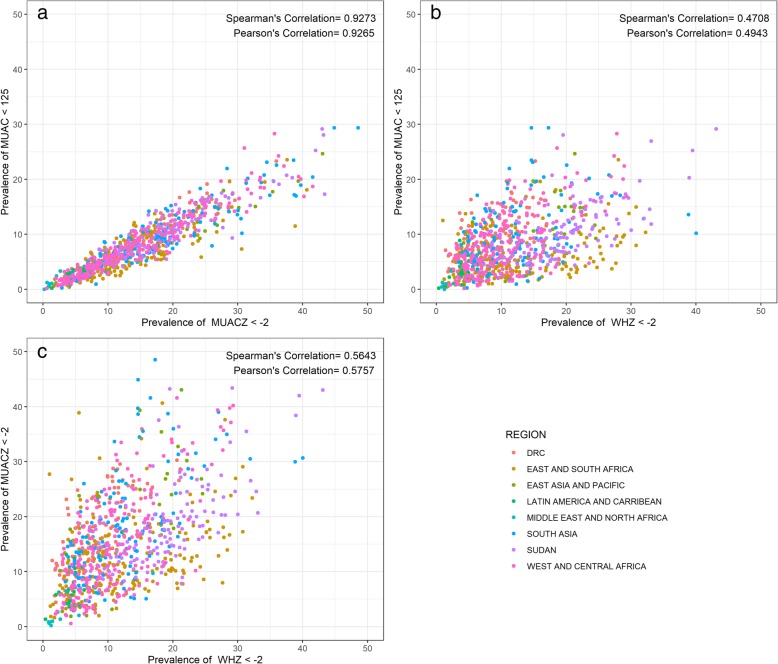
Fig. 2.
Pairwise correlation of prevalence of acute malnutrition indictor (MUAC and MUACZ, MUAC and WHZ, WHZ and MUACZ) (n = 882). Legend: Scatterplots of the correlation color coded by region between a prevalence of MUACZ < − 2 (x-axis) versus MUAC < 125 (y-axis), b prevalence of WHZ < − 2 (x-axis) versus MUAC < 125 (y-axis), c prevalence of WHZ < − 2 (x-axis) and prevalence of MUACZ < − 2 (y-axis). Regions represented by colors as follows: Democratic Republic of Congo (red), East and South Africa (dark yellow), East Asia and Pacific (green), Latin America and Caribbean (teal), Middle East and North Africa (turquoise), South (blue), Sudan (purple), West and Central Africa (pink)

