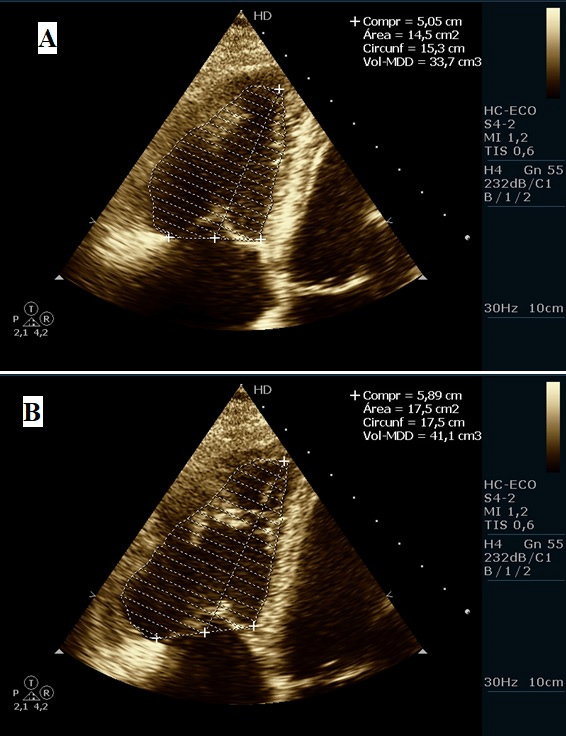
Figure 3.

Transthoracic echocardiogram. Right ventricle during systole (A) and diastole (B) and the difference between the area of the two ventricles (14.5 – 17.5 cm2) which is approximately 15% (which is below the normal value of 30%), thus attesting to the presence of right ventricle dysfunction.
