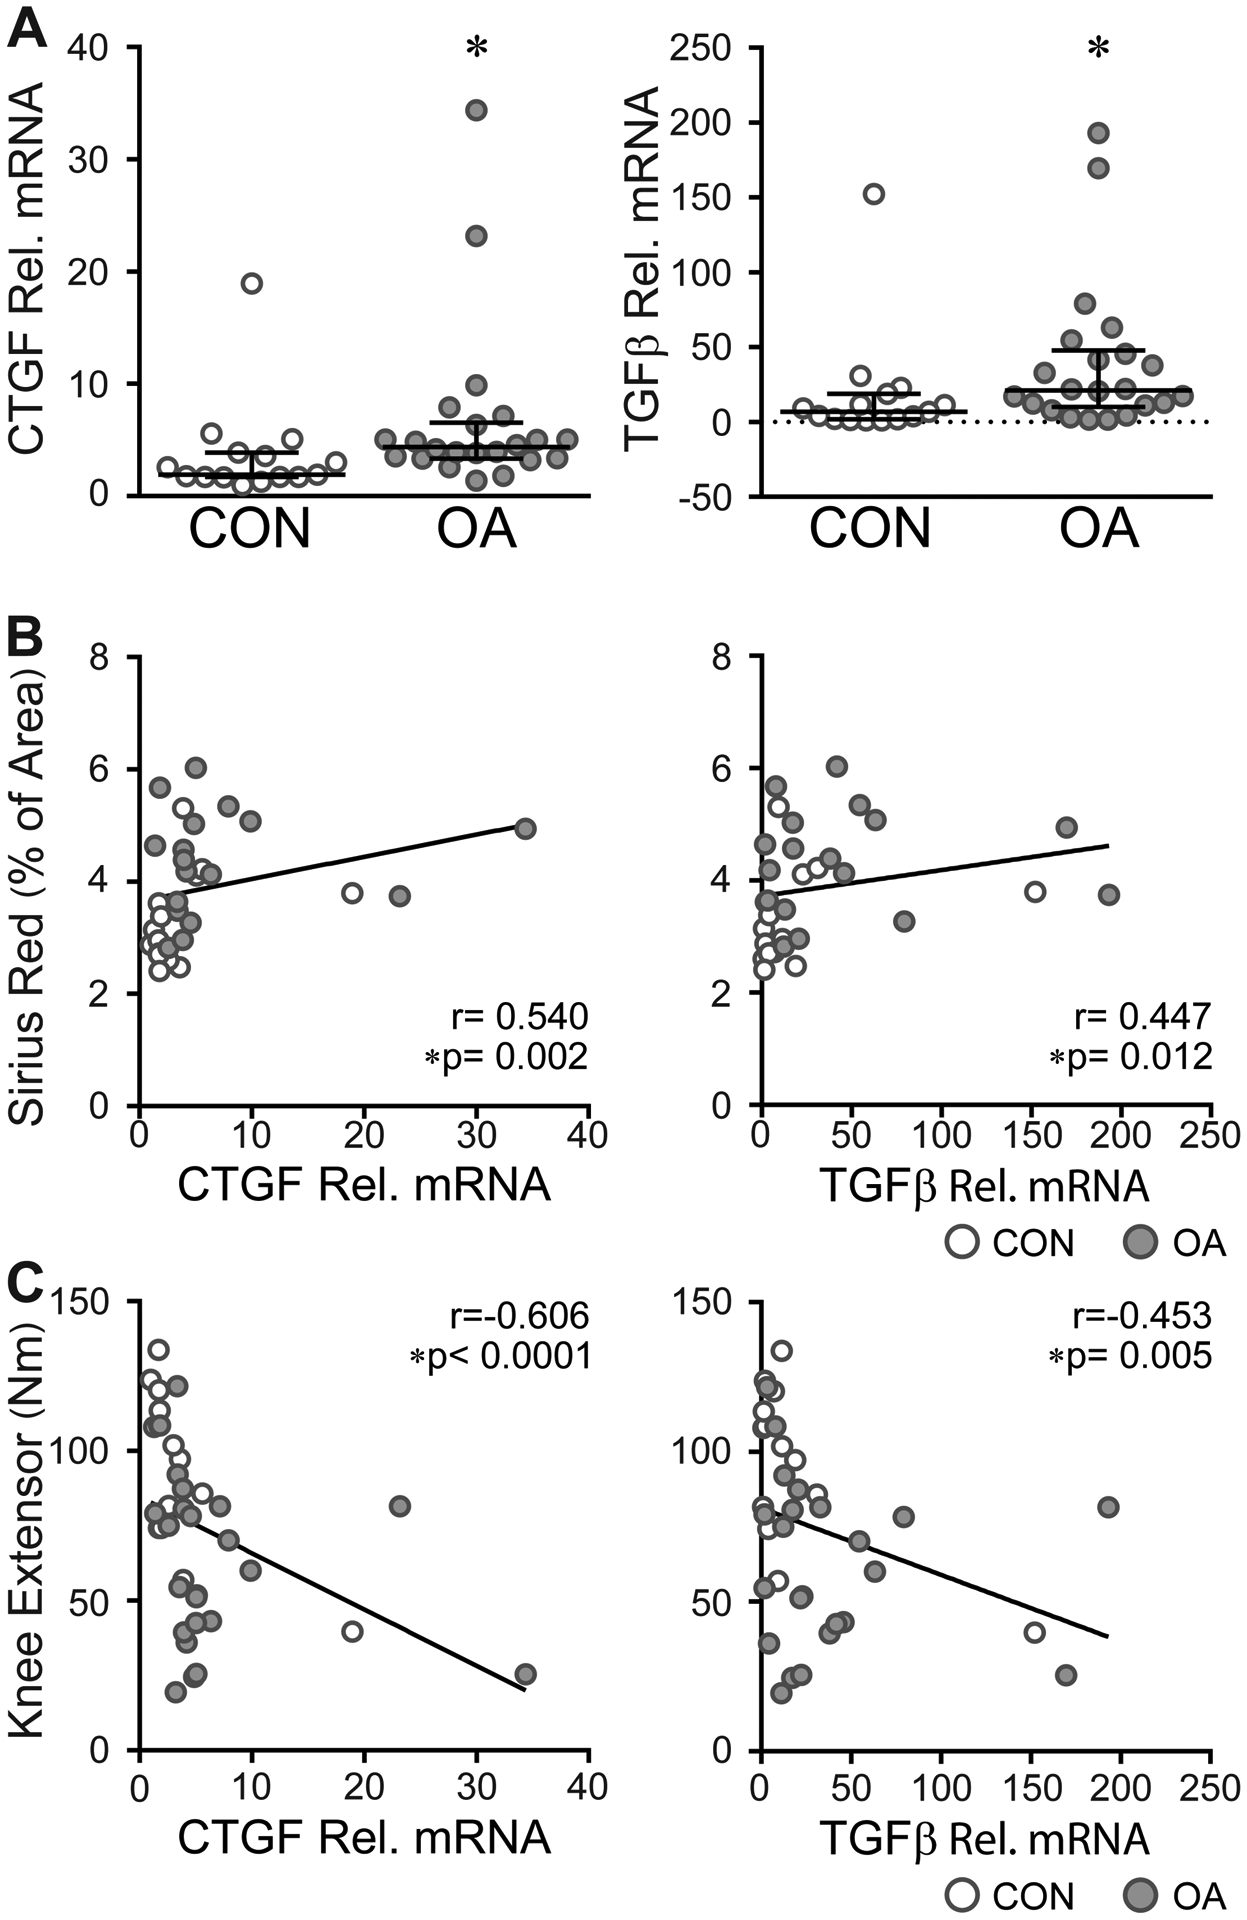
Fig. 4.

Differences in the expression of profibrotic genes in OA muscle. A) Bar graph showing the relative (rel.) mRNA expression of the profribrotic genes CTGF (left) and TGFβ (right) in control (CON) and OA muscle. Data are expressed as median with IQR; control (CON, n= 15) and OA (n= 22). Data analyzed by Mann-Whitney test, CTGF *P=0.0070, TGFβ *P=0.0152. B) Profibrotic gene expression is positively correlated to collagen deposition. CON (n=14), OA (n=18). C) Subjects with higher profibrotic gene expression have weaker quadriceps muscles. CON (n=15), OA (n=22). B-C) Data analyzed by two-tailed Spearman rho correlation.
