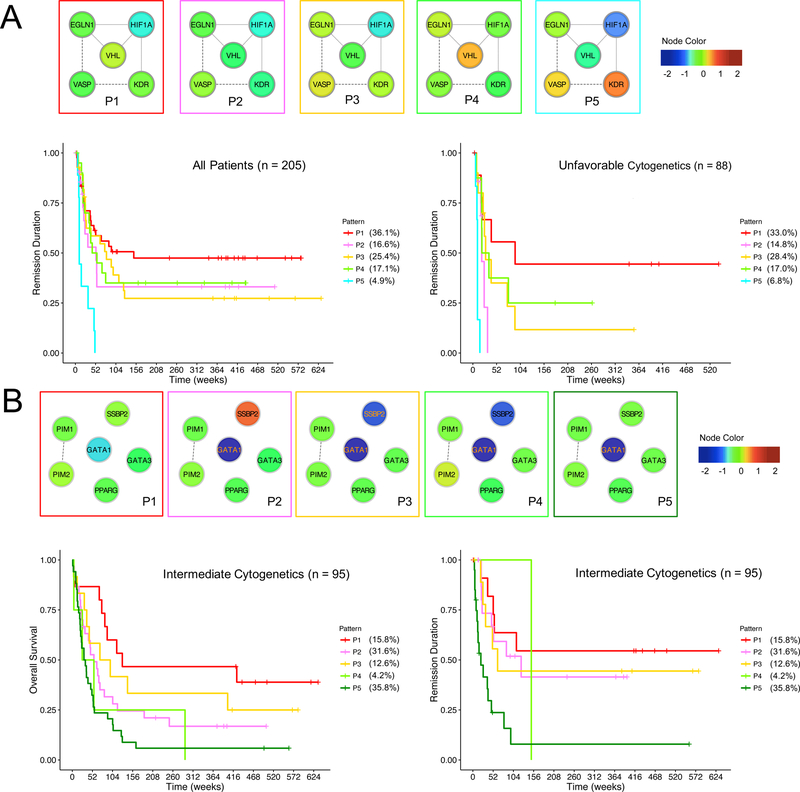
Figure 3. Example prognostic functional patterns.
Functional patterns were represented in protein networks, where the node color reflects the relative expression levels compared to the average expression levels in control samples. (A) In the Hypoxia group, the functional patterns stratify the remission duration among all patients (left, log-rank test of p = 0.01, one-sided, BH corrected) and the remission duration among patients with unfavorable cytogenetics (right, log-rank test of p = 0.00004, one-sided, BH corrected). (B) In the Differentiation group, the functional patterns stratify the overall survival (left, log-rank test of p = 0.109, one-sided, BH corrected) and remission duration (right, log-rank test of p = 0.031, one-sided, BH corrected) among patients with intermediate cytogenetics.

