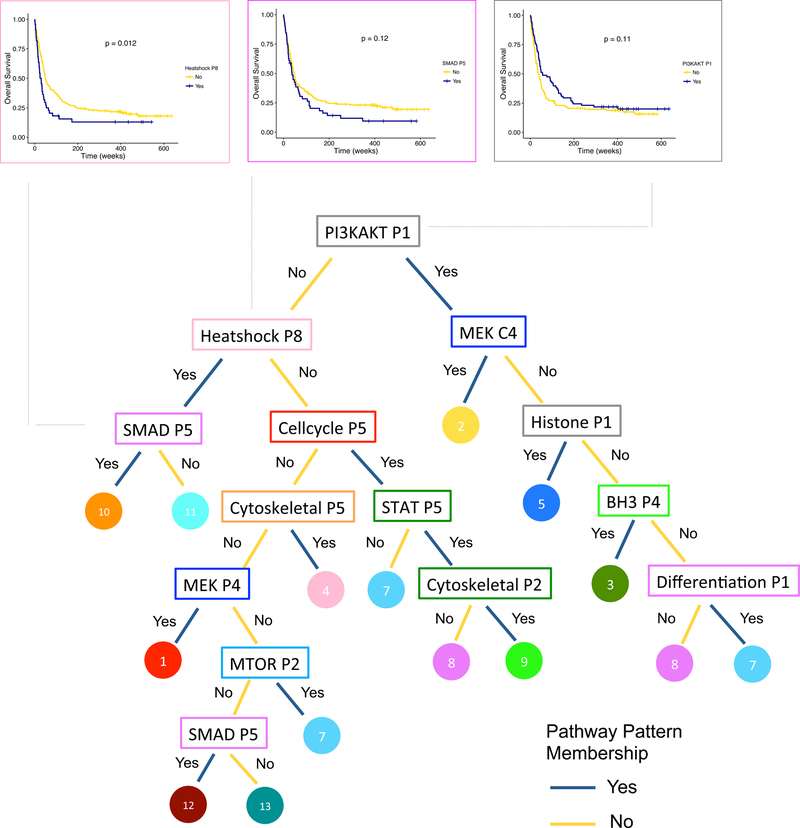
Figure 5. A tree of proteomic hallmarks in AML and its clinical relevance.
The tree illustrates the key functional patterns (in rectangles, color corresponds to constellation color in Figure 3A) that distinguish signatures (in circles, color corresponds to signature color in Figure 3A). The Kaplan-Meier curves for overall survival are shown for PI3KAKT-P1 (right), Heatshock-P8 (top left) and SMAD-P5 (second left), in which the blue curve represents patients displaying the functional pattern, and the yellow curve represents patients not displaying the pattern. PI3KAKT-P1 sample size n = 205 (Yes = 78, No = 127). Heatshock-P8 sample size n = 205 (Yes = 44, No = 161). SMAD-P5 sample size n = 205 (Yes = 51, No = 154). p-values shown for log-rank test, one-sided.

