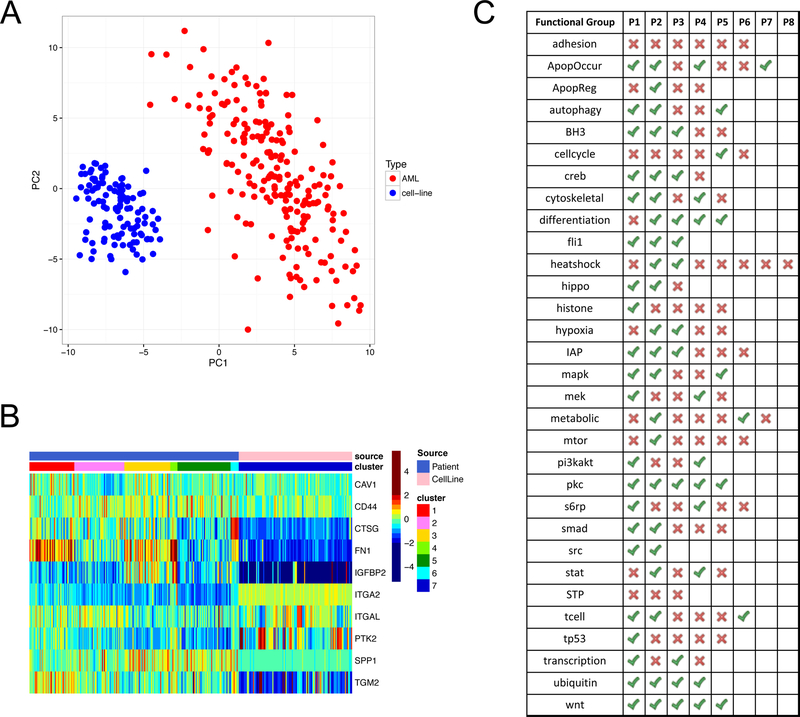
Figure 6. Proteomic comparison between AML patients and leukaemia cell lines.
(A) The first and second principal components of the protein expression levels show a complete separation between AML patients and cell lines. Patient sample size (n = 205), cell line sample size (n = 111). (B) The heatmap illustrates the expression patterns of both patients and cell lines in the Adhesion group. None of the cell lines (pink in top row) mimicked any of the 6 functional patterns identified in patients (blue in top row) and were therefore grouped into a new cluster (P7). (C) The table summarizes whether a functional pattern (identified in patients) can be found in any cell line tested in this study. Green ticks indicate that there is at least one cell line that has a similar expression pattern as the functional pattern, and red crosses indicate that no cell lines are found to mimic the functional pattern. Also see Table S5 for detailed matching between all cell lines and functional patterns.

